- Ripple stuck between 200 SMA support and 50 SMA resistance on the 4-hour chart.
- A slump in daily active addresses reveals low network activity, which is a bearish signal.
- A real break above $0.5 and the 50 SMA could trigger buy orders for gains beyond $0.6.
Ripple is attempting another recovery in the wake of the freefall to $0.45. The massive losses incurred since Wednesday have not been unique to the cross-border token. Bitcoin tumbled toward $50,000, while Ethereum tested the support at $1,500. At the time of writing, XRP is teetering at $0.49, while bulls battle for gains past $0.5.
Ripple pivotal between critical resistance and support
The international remittance token movement is limited between the 50 Simple Moving Average (SMA) resistance and the 200 SMA support on the 4-hour chart. Price action under the 200 SMA could lead to losses eyeing lower levels as far as $0.4 and $0.35, respectively.
Ripple's gravitational pull has been emphasized by the Moving Average Convergence Divergence (MACD) indicator on the 4-hour chart at the time of writing. If the indicator progresses into the negative region, we are bound to see XRP drop further.
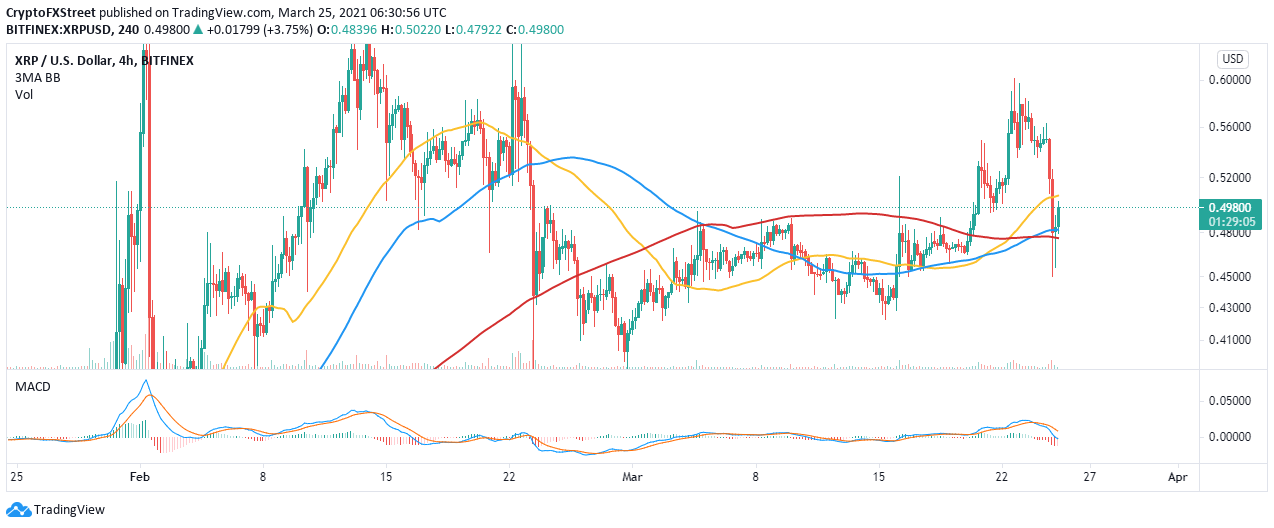
XRP/USD 4-hour chart
Consequently, Santiment, a leading behavioral analytics platform, highlights a significant slump in the number of daily unique addresses in XRP transactions. In other words, the metric measures the level of interaction or speculation in the community.
The number of daily active addresses topped out at 17,400 on March 22 but dropped to roughly 14,500 at the time of writing, representing a 16.6% decline in less than three days. If the addresses fail to recover, Ripple may continue to deal with rising overhead pressure.
Ripple daily active addresses
Looking at the other side of the fence
Ripple could soon resume the uptrend if the price cracks the resistance at $0.5 and the 50 SMA on the 4-hour chart. A move such as this would call out to buyers to join the market as speculation mounts for gains eyeing $0.6. It is also essential that the 200 SMA support holds to ensure market stability and allow bulls to focus on higher price levels.
Information on these pages contains forward-looking statements that involve risks and uncertainties. Markets and instruments profiled on this page are for informational purposes only and should not in any way come across as a recommendation to buy or sell in these assets. You should do your own thorough research before making any investment decisions. FXStreet does not in any way guarantee that this information is free from mistakes, errors, or material misstatements. It also does not guarantee that this information is of a timely nature. Investing in Open Markets involves a great deal of risk, including the loss of all or a portion of your investment, as well as emotional distress. All risks, losses and costs associated with investing, including total loss of principal, are your responsibility. The views and opinions expressed in this article are those of the authors and do not necessarily reflect the official policy or position of FXStreet nor its advertisers. The author will not be held responsible for information that is found at the end of links posted on this page.
If not otherwise explicitly mentioned in the body of the article, at the time of writing, the author has no position in any stock mentioned in this article and no business relationship with any company mentioned. The author has not received compensation for writing this article, other than from FXStreet.
FXStreet and the author do not provide personalized recommendations. The author makes no representations as to the accuracy, completeness, or suitability of this information. FXStreet and the author will not be liable for any errors, omissions or any losses, injuries or damages arising from this information and its display or use. Errors and omissions excepted.
The author and FXStreet are not registered investment advisors and nothing in this article is intended to be investment advice.
Recommended Content
Editors’ Picks

The crypto market is stuck in the mud
The crypto market has been hovering in a narrow range for the past four days, adding just over 2.5% over the past seven days to $2.72 trillion. These are levels below the 200-day moving average, indicating that the balance of power is now on the sellers' side.

Fintech and crypto firms push for bank licenses under Trump administration
Fintech and crypto firms seek bank charters under Trump, aiming for growth, lower costs, and legitimacy amid expectations of a more business-friendly regulation.

ETH consolidates below $2,000 as Standard Chartered alters its prediction for 2025
Standard Chartered analysts led by Geoffrey Kendrick lowered the bank's expectations for Ethereum's price in 2025. The bank adjusted its latest prediction, reducing Ethereum's 2025 price target from $10,000 to $4,000.

Solana price faces 50-day resistance as SOL futures debut on CME Group with $5M volume on fifth anniversary
Solana (SOL) stagnated around the $128 mark on Monday despite multiple bullish catalysts. The recent SOL unlocks by Alameda Research, ahead of FTX creditor repayments, have created a persistent bearish overhang since early March.

Bitcoin: BTC at risk of $75,000 reversal as Trump’s trade war overshadows US easing inflation
Bitcoin price remained constrained within a tight 8% channel between $76,000 and $84,472 this week. With conflicting market catalysts preventing prolonged directional swings, here are key factors that moved BTC prices this week, as well as key indicators to watch in the weeks ahead.

The Best brokers to trade EUR/USD
SPONSORED Discover the top brokers for trading EUR/USD in 2025. Our list features brokers with competitive spreads, fast execution, and powerful platforms. Whether you're a beginner or an expert, find the right partner to navigate the dynamic Forex market.