Ripple Price Analysis: XRP/USD recovers above 100-day SMA, closes in on $0.20
- XRP/USD stages a decisive rebound following a three-day slump.
- Ripple remains on track to close the day above 100-day SMA.
- The RSI indicator on the daily chart shows bullish momentum is gathering strength.

Ripple (XRP/USD) closed the previous three days in the negative territory and touched its lowest level in more than a week at $0.1885 on Thursday. After closing the day flat on Friday, XRP/USD rose sharply on Saturday and came within a touching distance of $0.20 before going into a consolidation phase. As of writing, the pair was up 1.8% on the day at $0.1980.
XRP/USD technical outlook
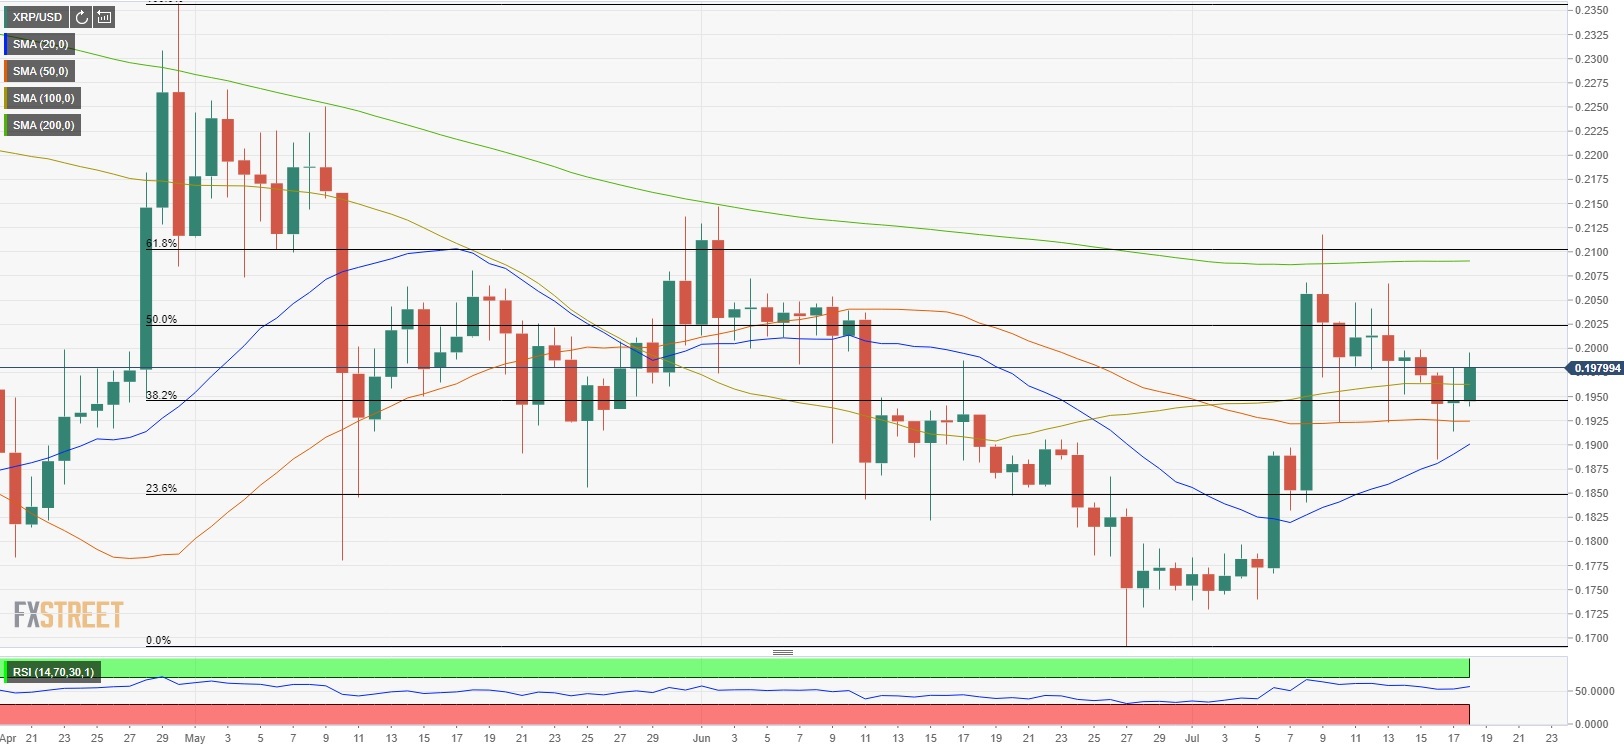
With Saturday's upsurge, XRP/USD broke above 100-day SMA and remains on track to end the day above that critical line. Additionally, the Relative Strength Index (RSI) is edging higher above 50, confirming the near-term bullish outlook.
On the upside, $0.2000 (daily high/psychological level) aligns as the initial resistance ahead of $0.2025 (Fibonacci 50% retracement of May-July drop). Supports, on the other hand, could be seen at $0.1960 (100-day SMA), $0.1925 (50-day SMA) and $0.1900 (20-day SMA).
Ripple chart (daily)
Author

Eren Sengezer
FXStreet
As an economist at heart, Eren Sengezer specializes in the assessment of the short-term and long-term impacts of macroeconomic data, central bank policies and political developments on financial assets.


