|

Ripple price analysis: XRP/USD dragged down by global crypto sell-off

  • XRP/USD is down nearly 7% amid market correction.
  • The RSI points to range-bound trading.

XRP/USD is changing hands at $0.3435, down nearly 7% since this time on Thursday. The second largest coin with a market capitalization $14B and an average daily trading volume about $588M is moving in lockstep with other major altcoins, driven by sentiments and technical factors on a low liquidity market.

Meanwhile, Ripple is down over 25% from the recent peak reached at $0.4600. The coin managed to recover from $0.2815 reached on December 14, though further upside looks unlikely at this stage.

Ripple's technical picture

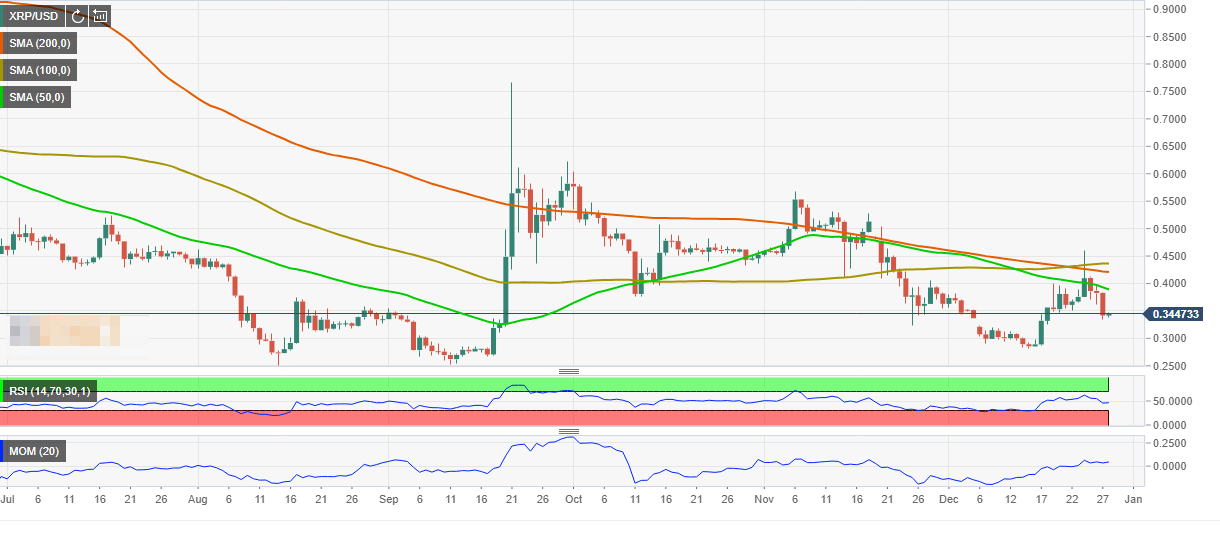
On a daily chart, XRP/USD broke above DMA50 but failed to keep the gains, creating a bearish setup. Now the strong support comes at a psychological $0.3000. Once this barrier is broken, the sell-off may continue towards the recent low $0.2815. On the upside, the ultimate resistance is created by the above-said DMA50, currently at $0.3890. It is followed by $0.4000 and $0.4220 (DMA100). A sustainable movement higher will take us to the recent high at $0.4607.

The RSI on the daily chart stays flat on the neutral territory, which implies that more rangebound trading may be in store.

XRP/USD, the daily chart

Author

Tanya Abrosimova

Tanya Abrosimova

Independent Analyst


More from Tanya Abrosimova
Share:

Editor's Picks

Ripple bulls defend key support amid waning retail demand and ETF inflows

XRP ticks up above $1.40 support, but waning retail demand suggests caution. XRP attracts $4 million in spot ETF inflows on Thursday, signaling renewed institutional investor interest.

Crypto Today: Bitcoin, Ethereum, XRP rebound as risk appetite improves

Bitcoin rises marginally, nearing the immediate resistance of $68,000 at the time of writing on Friday. Major altcoins, including Ethereum and Ripple, hold key support levels as bulls aim to maintain marginal intraday gains.

Bitcoin Weekly Forecast: No recovery in sight 

Bitcoin price continues to trade sideways between $65,729 and $71,746, extending its consolidation since February 7. US-spot ETFs record an outflow of $403.90 million through Thursday, pointing to the fifth consecutive week of withdrawals.

Pi Network Price Forecast: PI recovery stalls amid profit-taking

Pi Network tests 50-day EMA support on Friday, after a 5% decline the previous day. PiScan data shows large deposits on CEXs totaling over 4 million PI tokens in the last 24 hours, reflecting an exodus of investors taking profits.

Bitcoin Price Annual Forecast: BTC holds long-term bullish structure heading into 2026

Bitcoin (BTC) is wrapping up 2025 as one of its most eventful years, defined by unprecedented institutional participation, major regulatory developments, and extreme price volatility.

Bitcoin: No recovery in sight

Bitcoin (BTC) price continues to trade within a range-bound zone, hovering around $67,000 at the time of writing on Friday, and falling slightly so far this week, with no signs of recovery.