Ripple Price Analysis: XRP recovery becomes a major uphill battle despite stronger on-chain metrics
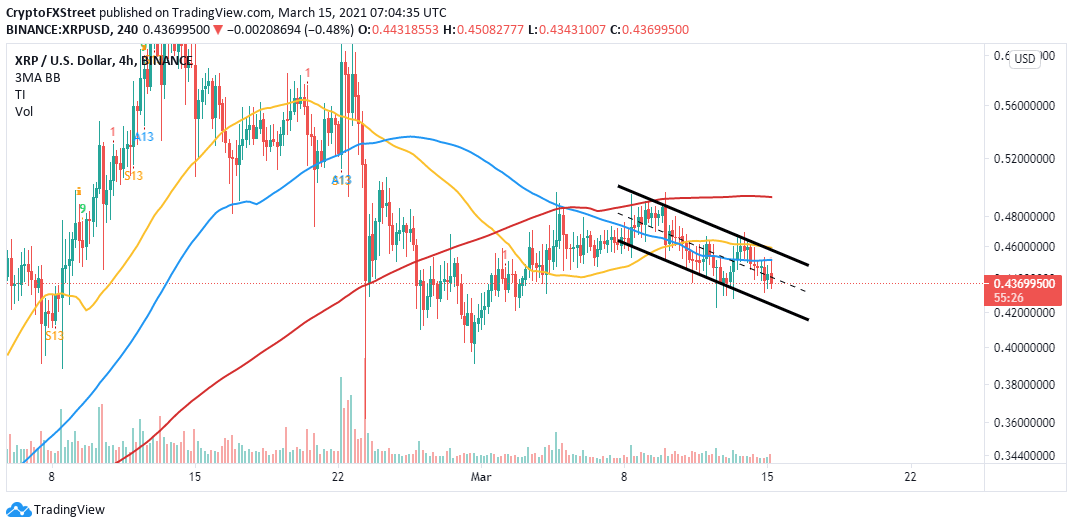
- Ripple is trading within a descending parallel channel while facing increased overhead pressure.
- MVRV shows that most Ripple holders are at a loss and are unlikely to sell.
- XRP whales increase their risk appetite in spite of the weak technical levels.
- Ripple will resume the uptrend to $0.5 if the channel's middle boundary support is reclaimed.

Ripple is trading at $0.43 after losing the ground above $0.45. Last week's trading was difficult for the bulls, especially with the intense selling pressure under $0.5. At the time of writing, XRP's least resistance path is downwards, particularly after losing the ground above a crucial technical pattern.
Ripple's improving on-chain picture
As the price drops further, Ripple whales' risk appetite becomes insatiable. Santiment's holder distribution metric reveals that large volume holders are consistently filling their bags. For instance, whales holding more than 10 million XRP bottomed out at 297 on February 22, traced a 30-day moving average, and have shot up to 309 at the time of writing.
The increase in the number of whales with tokens from 10 million to infinity is a bullish signal. As the buying pressure rises, Ripple's tailwind is bound to intensity, eventually lifting the prices higher.
Ripple holder distribution
Ripple's MVRV ratio stands at 0.43 and shows the profitability or loss of XRP to its holders. According to Santiment, this on-chain metric tracks "the average profit or loss of those holding XRP tokens which moved in the last 30 days, based on the price when each token last moved."
Note that an MVRV ratio of 2.0 shows that XRP holders, on average, have a return on investment of 2x the initial investment. On the other hand, an MVRV ratio of 1.0 or less says that most holders are at a loss and, therefore, are unlikely to sell. In other words, it is a good time to buy XRP as recovery will eventually come into the picture.
Ripple MVRV model
Ripple's technical picture is weakening, leaving tentative support levels vulnerable. Losing the descending channel's middle boundary support opened the Pandora box. Meanwhile, the lower edge of the channel is functioning as the immediate support. The downtrend has been validated by the Relative Strength Index (RSI) as it drops toward the oversold area.
XRP/USD 4-hour chart
Looking at the other side of the picture
It is worth mentioning that it is not all lost for the bulls because holding above the support channel's lower edge could return market stability. Moreover, gains above $0.45 are likely to shift the focus back to $0.5. However, the uptrend will not come easy due to the hurdles anticipated at the 100 Simple Moving Average (SMA) and the 50 SMA on the 4-hour chart.
Author

John Isige
FXStreet
John Isige is a seasoned cryptocurrency journalist and markets analyst committed to delivering high-quality, actionable insights tailored to traders, investors, and crypto enthusiasts. He enjoys deep dives into emerging Web3 tren
%2520%5B10.16.09%2C%252015%2520Mar%2C%25202021%5D-637513912177441784.png&w=1536&q=95)
%2520%5B10.25.25%2C%252015%2520Mar%2C%25202021%5D-637513912288449721.png&w=1536&q=95)


