- XRP/USD prints three-day losing streak despite staying above short-term support line.
- Bullish RSI, MACD can help restrict short-term downside around key support.
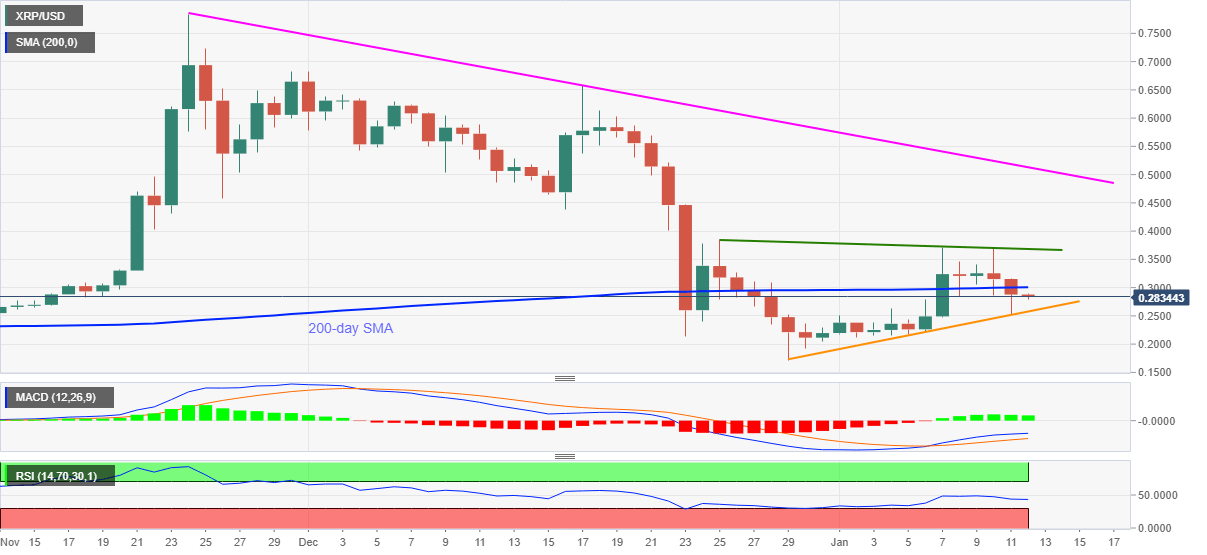
Failures to keep upside break of 200-day SMA drags XRP/USD towards revisiting a short-term support line. That said, the quote drops to 0.2820 during early Tuesday.
Considering ripple’s pullback from a downward slopping trend line since December 25, coupled with the recent drop below 200-day SMA, XRP/USD traders can revisit a short-term support line, at 0.2580.
However, any further losses will be challenged by bullish MACD and almost upbeat RSI conditions.
In a case where the XRP/USD sellers break the 0.2580 support line, the 0.2000 psychological magnet and the late-2020 low near 0.1720 may gain the market’s attention.
Alternatively, 200-day SMA and the stated resistance line, respectively around 0.3000 and 0.3685, will guard the pair’s immediate recovery moves.
Should the XRp/USD buyers manage to conquer 0.3685, a descending resistance line from November 24, at 0.5130 now, will be in the spotlight.
XRP/USD daily chart
Trend: Further weakness expected
Information on these pages contains forward-looking statements that involve risks and uncertainties. Markets and instruments profiled on this page are for informational purposes only and should not in any way come across as a recommendation to buy or sell in these assets. You should do your own thorough research before making any investment decisions. FXStreet does not in any way guarantee that this information is free from mistakes, errors, or material misstatements. It also does not guarantee that this information is of a timely nature. Investing in Open Markets involves a great deal of risk, including the loss of all or a portion of your investment, as well as emotional distress. All risks, losses and costs associated with investing, including total loss of principal, are your responsibility. The views and opinions expressed in this article are those of the authors and do not necessarily reflect the official policy or position of FXStreet nor its advertisers. The author will not be held responsible for information that is found at the end of links posted on this page.
If not otherwise explicitly mentioned in the body of the article, at the time of writing, the author has no position in any stock mentioned in this article and no business relationship with any company mentioned. The author has not received compensation for writing this article, other than from FXStreet.
FXStreet and the author do not provide personalized recommendations. The author makes no representations as to the accuracy, completeness, or suitability of this information. FXStreet and the author will not be liable for any errors, omissions or any losses, injuries or damages arising from this information and its display or use. Errors and omissions excepted.
The author and FXStreet are not registered investment advisors and nothing in this article is intended to be investment advice.
Recommended Content
Editors’ Picks
Celebrity meme coins controversy continues amid Pump.fun revenue dominance
![Celebrity meme coins controversy continues amid Pump.fun revenue dominance](https://editorial.fxstreet.com/images/Resources/CryptoWorldSEO3_XtraSmall.jpg)
Pump.fun outperformed the Ethereum blockchain on Tuesday after raking in $1.99 million. Following this achievement, a meme coin based on actress Sydney Sweeney was the subject of controversy after its developers dumped their bags on investors.
PEPE's on-chain metrics indicate potential rally after weeks of silence
![PEPE's on-chain metrics indicate potential rally after weeks of silence](https://editorial.fxstreet.com/images/Markets/Currencies/Cryptocurrencies/PEPE/PEPE_coin_XtraSmall.jpg)
PEPE has struggled to see any significant price move after reaching an all-time high in May. Increased adoption rate and low MVRV ratio indicate a bullish run may be on the horizon. A single PEPE outflow from Binance worth $14.7 million gives credence to signs of bullish expectation.
Ethereum has failed to overcome key resistance despite bullish sentiment surrounding ETH ETF
![Ethereum has failed to overcome key resistance despite bullish sentiment surrounding ETH ETF](https://editorial.fxstreet.com/images/Markets/Currencies/Digital%20Currencies/Ethereum/ethereum_2_XtraSmall.jpg)
Ethereum (ETH) is down more than 1.4% on Tuesday following another ETH sale from the Ethereum Foundation. Meanwhile, crypto exchange Gemini's recent report reveals that ETH ETF could see about $5 billion in net inflows within six months of launch.
Crypto community blasts Polkadot following report of treasury spending
![Crypto community blasts Polkadot following report of treasury spending](https://editorial.fxstreet.com/images/Markets/Currencies/Cryptocurrencies/Polkadot/polkadot-150x150logo-637399979978734311_XtraSmall.png)
Polkadot reports $87 million of treasury spending during H1. Crypto community members expressed harsh feelings toward the DOT team's high spending. DOT is up more than 2% in the past 24 hours but risks correction following the report.
Bitcoin: BTC price correction could end in July, according to seasonal data
![Bitcoin: BTC price correction could end in July, according to seasonal data](https://editorial.fxstreet.com/images/Markets/Currencies/Digital%20Currencies/Bitcoin/bitcoin_5_XtraSmall.jpg)
Bitcoin (BTC) price appears poised for a decline this week, influenced by slight outflows in US spot ETFs, selling activity among BTC miners, and a combined transfer of 4,690.28 BTC to centralized exchanges by the US and German governments.