Ripple Price Analysis: XRP bullish potential to $1.0 remains intact despite recent pullback


  • XRP/USD extends U-turn from two-week high to refresh intraday low.
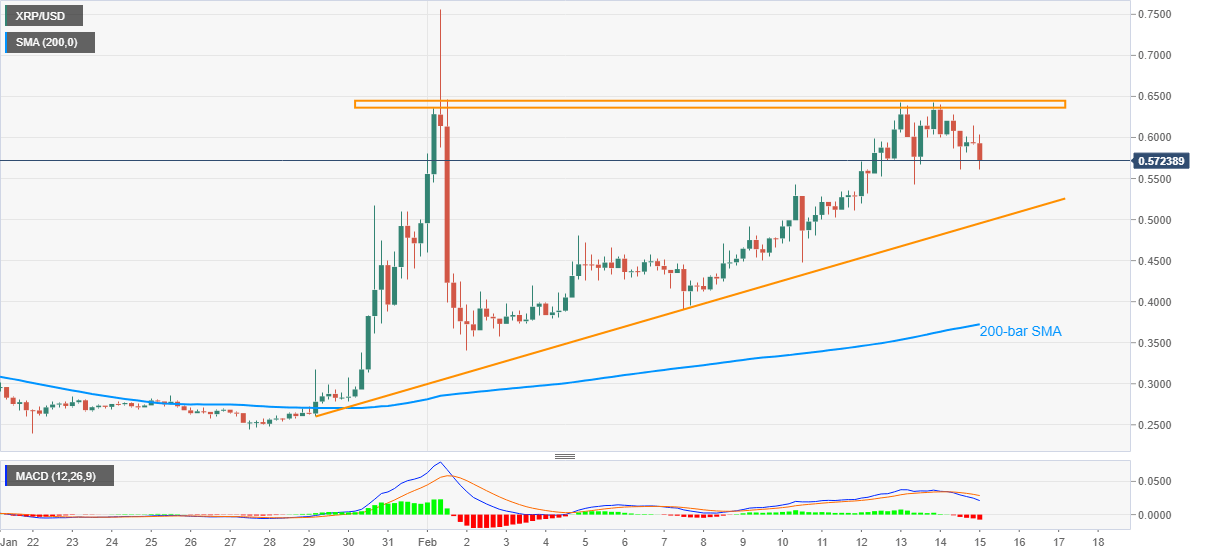
  • Sustained trading beyond 200-bar SMA keeps buyers hopeful.
  • Short-term sellers may try to confirm short-term ascending triangle amid bearish MACD.

XRP/USD stands on a slippery ground while refreshing the intraday low to $0.5620, down around 5.0% intraday, during early Monday. In doing so, the altcoin extends pullback from the highest levels since February 01 while also respecting multiple tops marked during the last two weeks.

Considering the bearish MACD signals and the cryptocurrency pair’s failures to cross the immediate hurdle, XRP/USD is likely witnessing short-term downside pressure towards an ascending trend line from January 29, at $0.4953 now.

Though, a clear downside break of $0.4953 will confirm the bearish technical pattern, ascending triangle breakdown, while directing ripple sellers toward the 200-bar SMA level of $0.3725.

It should, however, be noted that the XRP/USD bulls may remain optimistic unless the quote keeps the monthly run-up beyond the key SMA. As a result, any clear break below $0.3725 will be detrimental for the bullish trend.

Alternatively, fresh buying can wait for a clear break above $0.6360 wherein December 2020 peak of $0.6577 and late-November 2020 high near $0.6830 will entertain the XRP/USD bulls.

In a case where XRP/USD remains firm above 0.6830, the latest high of $0.7565 and the year 2020 peak surrounding $0.7850 can offer intermediate halts before the $1.0 psychological magnet.

XRP/USD four-hour chart

Trend: Further pullback expected

Additional important levels

Overview
Today last price 0.5782
Today Daily Change -0.0147
Today Daily Change % -2.48%
Today daily open 0.5929
 
Trends
Daily SMA20 0.4357
Daily SMA50 0.3365
Daily SMA100 0.4003
Daily SMA200 0.3301
 
Levels
Previous Daily High 0.6406
Previous Daily Low 0.5614
Previous Weekly High 0.6247
Previous Weekly Low 0.3911
Previous Monthly High 0.5167
Previous Monthly Low 0.2109
Daily Fibonacci 38.2% 0.5916
Daily Fibonacci 61.8% 0.6103
Daily Pivot Point S1 0.556
Daily Pivot Point S2 0.5191
Daily Pivot Point S3 0.4768
Daily Pivot Point R1 0.6352
Daily Pivot Point R2 0.6775
Daily Pivot Point R3 0.7144


Information on these pages contains forward-looking statements that involve risks and uncertainties. Markets and instruments profiled on this page are for informational purposes only and should not in any way come across as a recommendation to buy or sell in these assets. You should do your own thorough research before making any investment decisions. FXStreet does not in any way guarantee that this information is free from mistakes, errors, or material misstatements. It also does not guarantee that this information is of a timely nature. Investing in Open Markets involves a great deal of risk, including the loss of all or a portion of your investment, as well as emotional distress. All risks, losses and costs associated with investing, including total loss of principal, are your responsibility. The views and opinions expressed in this article are those of the authors and do not necessarily reflect the official policy or position of FXStreet nor its advertisers. The author will not be held responsible for information that is found at the end of links posted on this page.

If not otherwise explicitly mentioned in the body of the article, at the time of writing, the author has no position in any stock mentioned in this article and no business relationship with any company mentioned. The author has not received compensation for writing this article, other than from FXStreet.

FXStreet and the author do not provide personalized recommendations. The author makes no representations as to the accuracy, completeness, or suitability of this information. FXStreet and the author will not be liable for any errors, omissions or any losses, injuries or damages arising from this information and its display or use. Errors and omissions excepted.

The author and FXStreet are not registered investment advisors and nothing in this article is intended to be investment advice.

Join Telegram

Recommended content


Recommended Content

Editors’ Picks

Ripple on-chain metrics show bullish signs amidst legal struggle with SEC, XRP eyes recovery

Ripple on-chain metrics show bullish signs amidst legal struggle with SEC, XRP eyes recovery

Ripple made a comeback above $0.48 on Tuesday and hovers above that level in Wednesday’s European session. Ripple on-chain metrics such as transaction volume and Network Realized Profit/Loss have turned bullish, supporting a recovery in the altcoin. 

More Ripple News

Bitcoin price falls amidst German government transfers, miners activity

Bitcoin price falls amidst German government transfers, miners activity

Bitcoin (BTC) extends correction on Wednesday and hovers around $61,000 after finding resistance near the $64,000 level on Monday. Recent on-chain data indicates heightened selling activity from Bitcoin miners early in the week. 

More Bitcoin News

Crypto Today: Bitcoin erases gains from end of June, Ethereum declines while Ripple holds

Crypto Today: Bitcoin erases gains from end of June, Ethereum declines while Ripple holds

Bitcoin wipes out gains from the last week of June and falls below $60,000 on Wednesday. Ethereum and top altcoins ranked by market capitalization erased gains as the inflation outlook worsened. Ripple holds on to recent gains and hovers above $0.48 on Wednesday. 

More Cryptocurrencies News

Three reasons why altcoins could shake off losses this week

Three reasons why altcoins could shake off losses this week

On-chain data from Santiment shows that altcoins are currently in the opportunity zone, or generating buy signals. The top three altcoins in the buy zone are Basic Attention Token (BAT), Chromia (CHR), and Highstreet (HIGH), per Santiment. 

More Altcoins News

Bitcoin: BTC price correction could end in July, according to seasonal data

Bitcoin: BTC price correction could end in July, according to seasonal data

Bitcoin (BTC) price appears poised for a decline this week, influenced by slight outflows in US spot ETFs, selling activity among BTC miners, and a combined transfer of 4,690.28 BTC to centralized exchanges by the US and German governments.

Read full analysis

BTC

ETH

XRP