• Ripple price action broke below an intermediary ascending trend line.
  • The 55-day SMA is providing a temporary floor and triggering a bounce.
  • With this window of opportunity, it is time for bulls to take their profits and run before XRP price is set to collapse by 18%.

Ripple (XRP) price action breaks below an intermediary ascending trend line that formed the backbone for the current uptrend after the invasion of Russia into Ukraine. Although the trend line provided support for a bounce yesterday, delivering a rejection of bears, the current losses in European stock markets has created leverage in safe havens and given bears the upper hand in risk assets like cryptocurrencies. Currently, the 55-day Simple Moving Average (SMA) at $0.73 is providing support to a pull-back, but with non-farm payrolls and a possible eventful weekend in Ukraine again, expect that support to be broken later today with XRP price action dropping as much as 18% to $0.62.

Time to take the parachute and head for the exit 

Ripple price action is in risky territory for bulls as bears are taking over again going into the weekend. Since bulls were unfit to break above $0.78 and seize $0.80 to the upside, the price has been trading to the downside for the third day in a row today. As the bearish pressure mounts, a short-term supporting trend line has been broken to the downside and, as such, has halted the recovery rally since Russia entered Ukraine.

For now, XRP bulls see the 55-day SMA holding and creating a bounce on a test, but the pressure is mounting with lower highs intraday as safe havens are heavily bid, and the dollar strength is adding momentum for bears to push more to the downside. Expect a break of $0.73 to the downside to trigger a drop to $0.70. Once below there, there is not much in the way to prevent a drop towards $0.62, which was the low of February 24 and caught the falling knife action – to the tick on that day, but spells an 18% loss for XRP against where we are at the moment.
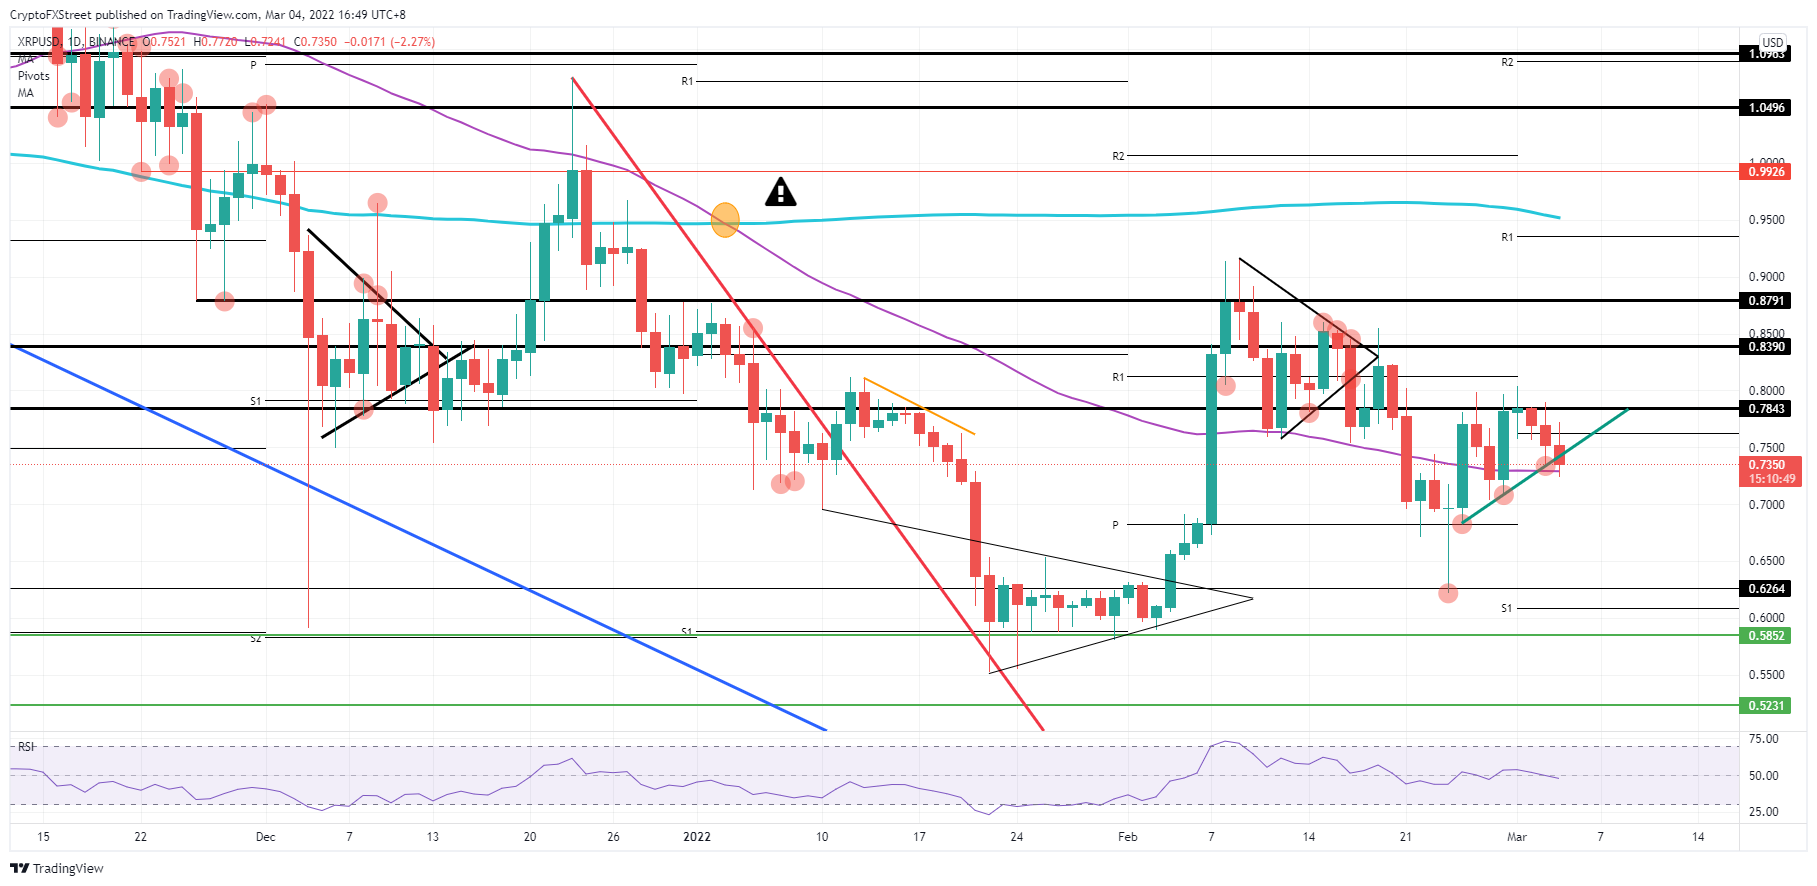
XRP/USD daily chart

XRP/USD daily chart

Markets would welcome a cease-fire to depressurize the current situation and give markets some relief. Assets classes often move in one direction as an elastic band and sooner or later need to partially unwind a stretched position, which would be no different for XRP price action. With such a move, expect to see a leg up towards $0.78 or $0.80 and with a test specifically at $0.8030, which is the double top from February 21 and March 01.


Information on these pages contains forward-looking statements that involve risks and uncertainties. Markets and instruments profiled on this page are for informational purposes only and should not in any way come across as a recommendation to buy or sell in these assets. You should do your own thorough research before making any investment decisions. FXStreet does not in any way guarantee that this information is free from mistakes, errors, or material misstatements. It also does not guarantee that this information is of a timely nature. Investing in Open Markets involves a great deal of risk, including the loss of all or a portion of your investment, as well as emotional distress. All risks, losses and costs associated with investing, including total loss of principal, are your responsibility. The views and opinions expressed in this article are those of the authors and do not necessarily reflect the official policy or position of FXStreet nor its advertisers. The author will not be held responsible for information that is found at the end of links posted on this page.

If not otherwise explicitly mentioned in the body of the article, at the time of writing, the author has no position in any stock mentioned in this article and no business relationship with any company mentioned. The author has not received compensation for writing this article, other than from FXStreet.

FXStreet and the author do not provide personalized recommendations. The author makes no representations as to the accuracy, completeness, or suitability of this information. FXStreet and the author will not be liable for any errors, omissions or any losses, injuries or damages arising from this information and its display or use. Errors and omissions excepted.

The author and FXStreet are not registered investment advisors and nothing in this article is intended to be investment advice.

Join Telegram

Recommended content


Recommended Content

Editors’ Picks

Celebrity meme coins controversy continues amid Pump.fun revenue dominance

Celebrity meme coins controversy continues amid Pump.fun revenue dominance

Pump.fun outperformed the Ethereum blockchain on Tuesday after raking in $1.99 million. Following this achievement, a meme coin based on actress Sydney Sweeney was the subject of controversy after its developers dumped their bags on investors.

More Meme Coins News

PEPE's on-chain metrics indicate potential rally after weeks of silence

PEPE's on-chain metrics indicate potential rally after weeks of silence

PEPE has struggled to see any significant price move after reaching an all-time high in May. Increased adoption rate and low MVRV ratio indicate a bullish run may be on the horizon. A single PEPE outflow from Binance worth $14.7 million gives credence to signs of bullish expectation.

More Pepe News

Ethereum has failed to overcome key resistance despite bullish sentiment surrounding ETH ETF

Ethereum has failed to overcome key resistance despite bullish sentiment surrounding ETH ETF

Ethereum (ETH) is down more than 1.4% on Tuesday following another ETH sale from the Ethereum Foundation. Meanwhile, crypto exchange Gemini's recent report reveals that ETH ETF could see about $5 billion in net inflows within six months of launch.

More Ethereum News

Crypto community blasts Polkadot following report of treasury spending

Crypto community blasts Polkadot following report of treasury spending

Polkadot reports $87 million of treasury spending during H1. Crypto community members expressed harsh feelings toward the DOT team's high spending. DOT is up more than 2% in the past 24 hours but risks correction following the report.

More Polkadot News

Bitcoin: BTC price correction could end in July, according to seasonal data

Bitcoin: BTC price correction could end in July, according to seasonal data

Bitcoin (BTC) price appears poised for a decline this week, influenced by slight outflows in US spot ETFs, selling activity among BTC miners, and a combined transfer of 4,690.28 BTC to centralized exchanges by the US and German governments.

Read full analysis

BTC

ETH

XRP