Resistance persists at $1,350 but this chart pattern forecasts 11% move in Ethereum price
- Ethereum price’s strong rebound tags $1,328 but runs straight into an acute resistance around $1,350.
- A double-bottom pattern will likely confirm on the four-hour chart ahead of a bullish breakout to $1,496.
- Large volume holders must positively flip their sentiment on Ethereum to sustain an uptrend.

Ethereum price is doddering at $1,328 after climbing 8.3% over the last 24 hours. The second-largest cryptocurrency looks forward to dispersing a strong supply area at $1,350, a move that could propel it to $1,496.
Ethereum price inches closer to a bullish breakout'
A double-bottom pattern appeared on the four-hour chart after the token tested support at $1,230 for the second time since September 22. This bullish technical pattern usually leads to a trend reversal, presenting traders with an opportunity to take long positions in ETH price.
It is worth mentioning that the double-bottom pattern forms after an extended downtrend, characterized by two valleys – the bottoms. As the price bounces from the second valley, Ethereum price begins the process reversal through validation of a bullish breakout.
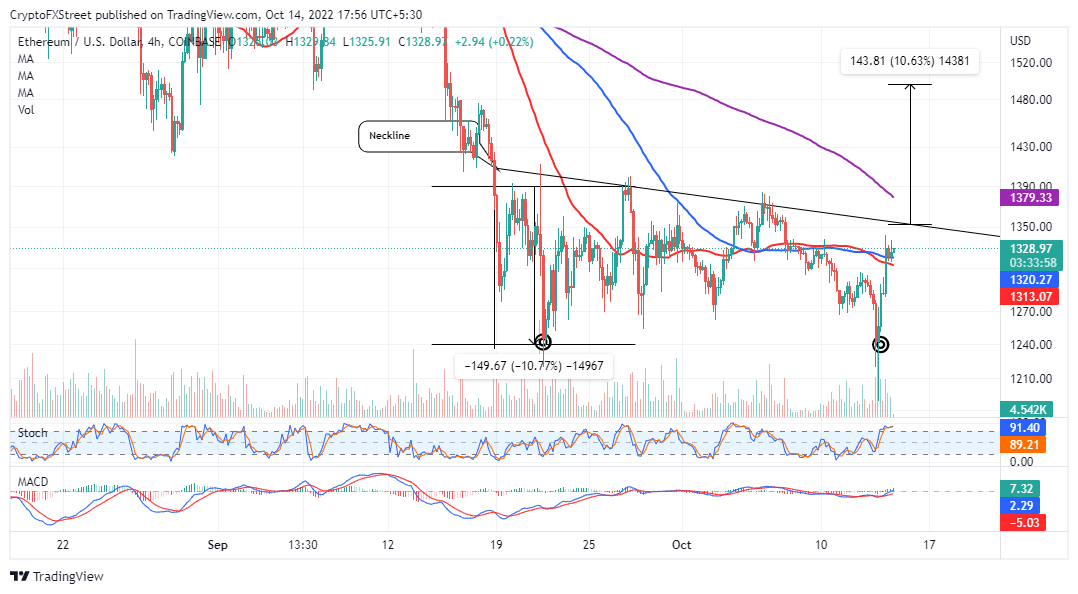
ETH/USD four-hour chart
A spike in volume is necessary to ascertain the uptrend’s viability. However, traders must exercise patience until Ethereum price rises above the neckline resistance before activating buy orders.
Ethereum eyes an 11.77% move to $1,496 from the breakout point at $1,350. The 50-day SMA (Simple Moving Average), red, and the 100-day SMA, blue, are giving support to Ethereum price at $1,313 and $1,320, respectively.
The MACD (Moving Average Convergence Divergence) indicator position above the mean line reveals a growing bullish impact on Ethereum price. Strong demand behind ETH is necessary for a successful attack on the supply area at $1,350. The path with the least resistance will remain to the upside as long as the MACD maintains a positive divergence from the moving average.
Ethereum whales hit the brakes as selling spree cools off
On-chain data from Glassnode may soon paint a positive picture for Ethereum price if investors holding 1,000 and more tokens stop selling and double down efforts to fill their bags. The chart below shows 6,313 addresses in that cohort, down from 6,516 on September 15.
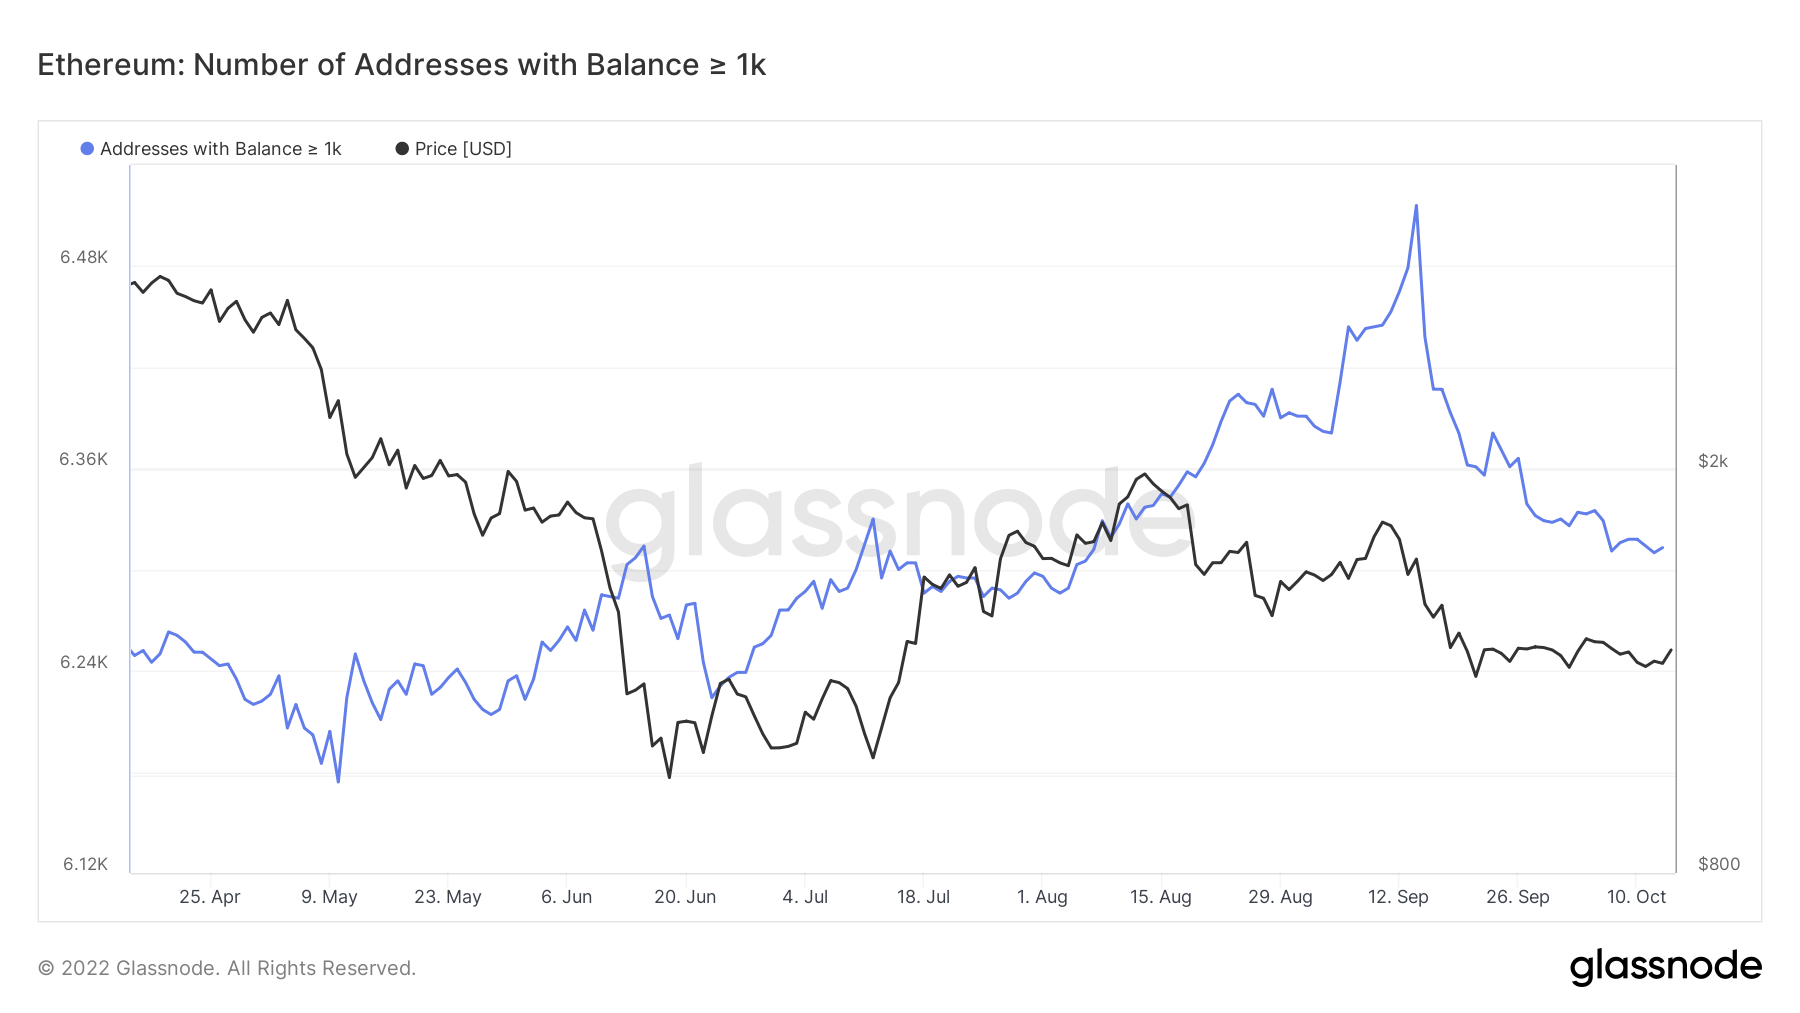
Ethereum Number of Addresses with Balance ≥ 1k
If the line curve (blue) in the chart above flips the gradient to the upside, Ethereum price will be able to breathe and chart a recovery path. Nevertheless, whales must shun skepticism for Ethereum price to sustain an uptrend to $1,496 or even to $2,000. In other words, the previously dominant selling spree has to stop for ETH price to climb the ladder.
Author

John Isige
FXStreet
John Isige is a seasoned cryptocurrency journalist and markets analyst committed to delivering high-quality, actionable insights tailored to traders, investors, and crypto enthusiasts. He enjoys deep dives into emerging Web3 tren