- Reserve Rights price is facing a pullback after testing the 61.8% Fibonacci retracement level at $0.0100.
- On-chain data suggests that RSR development activity is growing.
- A daily candlestick close below $0.0057 would invalidate the bullish thesis.
Reserve Rights (RSR) price is facing a pullback to retest its support area before rallying further.
On-chain data suggest that the RSR development is growing, and prices could rally by 25%.
Reserve Rights price eyes for a 25% rally
Reserve Rights price is retracing toward the $0.0075 pullback after a rejection at the 61.8% Fibonacci retracement level at $0.0100, drawn from a swing high of $0.0133 on March 26 to a swing low of $0.0047 on April 13. If RSR bounces off from the said support level, it could rally 25% and tag the resistance level of $0.0094.
The Relative Strength Index (RSI) and Awesome Oscillator (AO) indicators are yet to retest their respective mean levels of 50 and 0. If the bullish momentum is strong, it could defend the $0.0075 support level, leading to a bounce in the RSI and AO indicators. This development would confirm the persistence of the uptrend narrative.
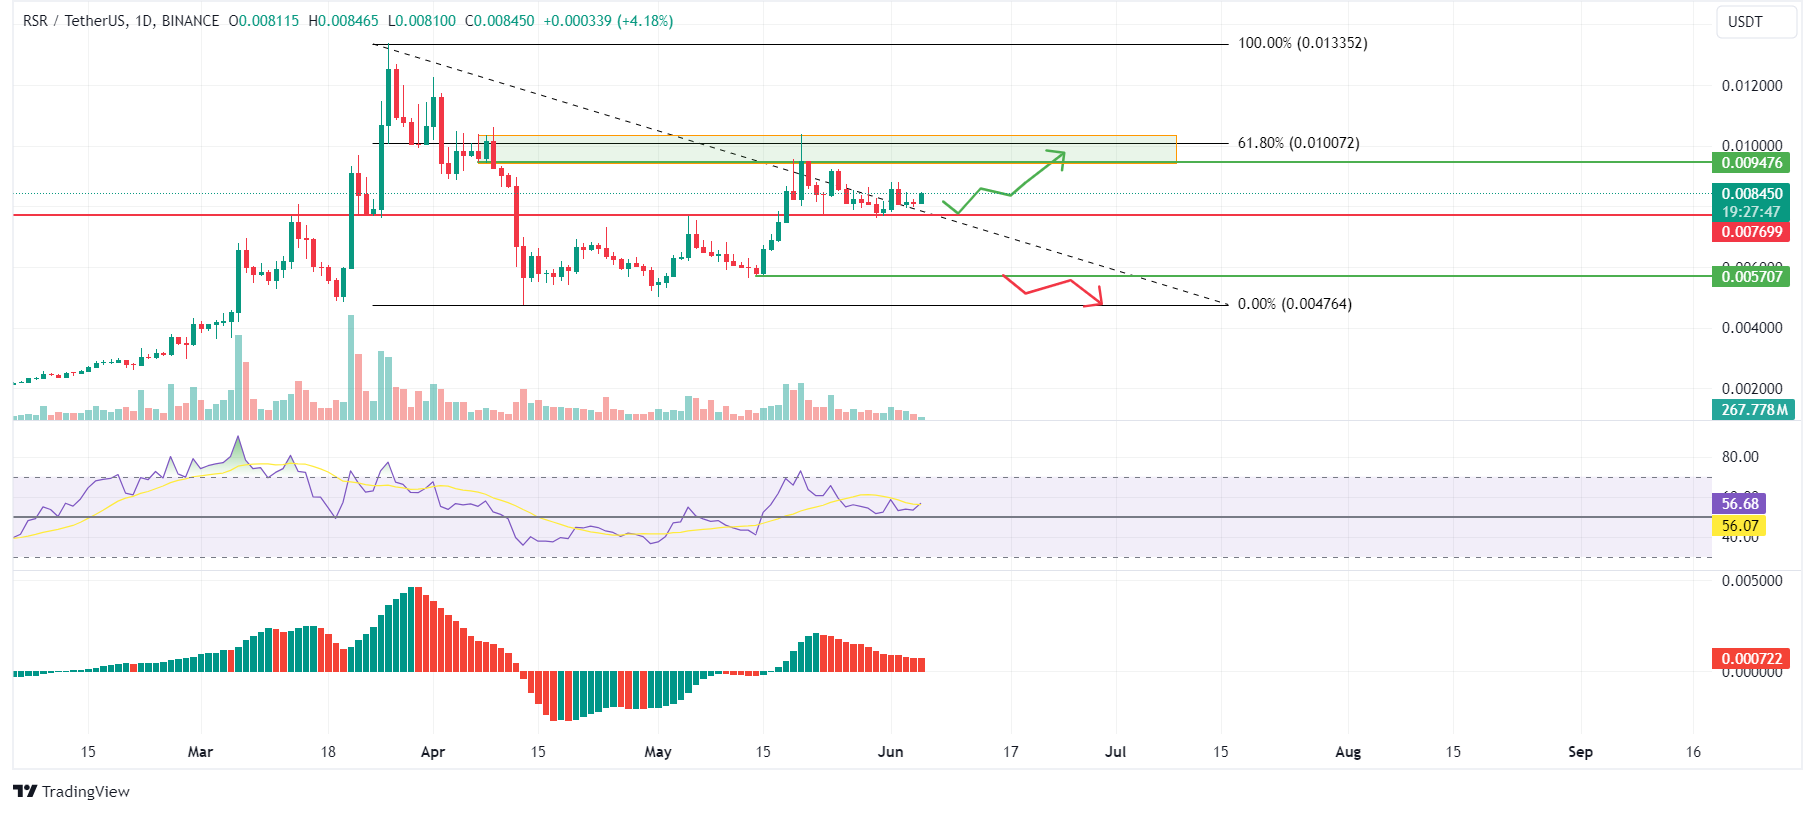
RSR/USDT 1-day chart
Based on IntoTheBlock's In/Out of the Money Map (IOMAP), nearly 455 addresses accumulated 3.15 billion RSR tokens at an average price of $0.0080. These investors bought RSR between $0.0079 and $0.0082, and are likely to accumulate more if the price dips into the area.
The $0.0075 support level mentioned from a technical analysis perspective coincides with the IOMAP findings, making this zone a key reversal zone to watch.
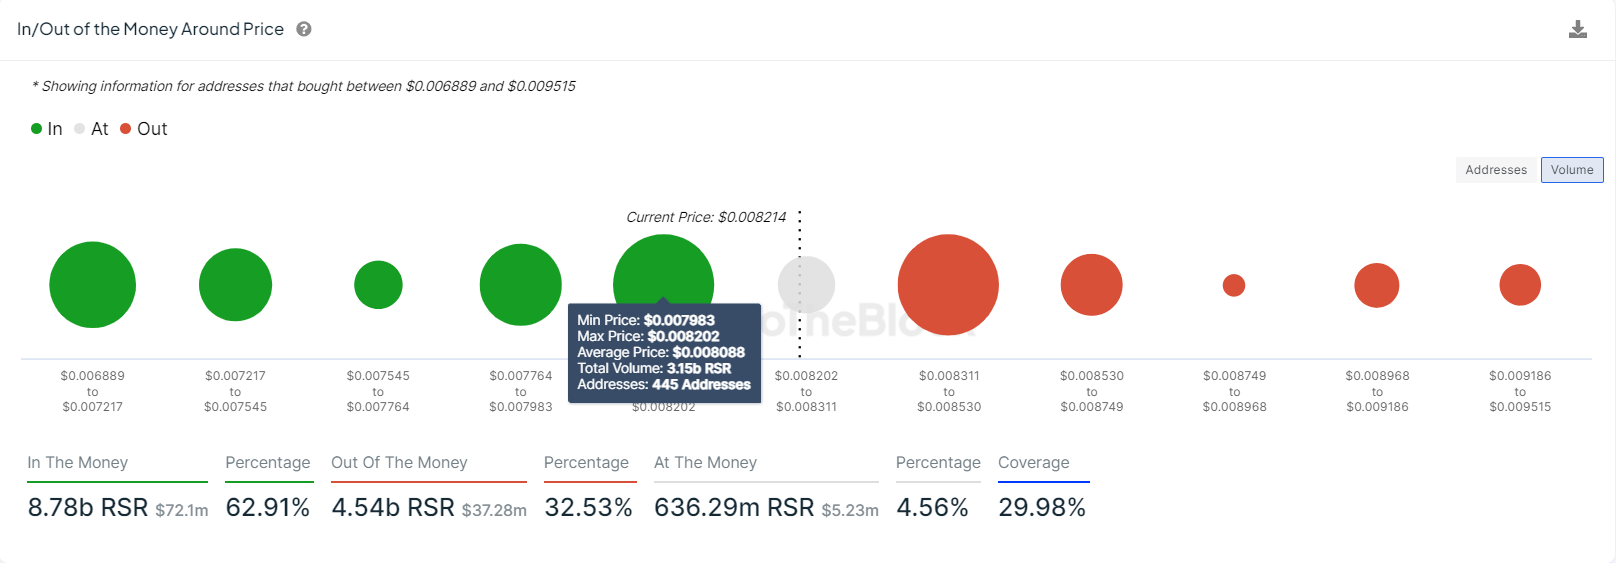
RSR IOMAP chart
Santiment’s Development Activity index shows project development activity over time based on a number of pure development-related events in the project's public GitHub repository. In RSR’s case, a sharp rise in the index from 1.21 on May 29 to 3.09 on June 5, implies that the Reserve Rights developing activity is high, which adds further credence to the bullish outlook.
%20[07.56.32,%2005%20Jun,%202024]-638531594506617071.png)
RSR Development Activity chart
Despite the bullish thesis signaled by both on-chain data and technical analysis, if the RSR daily candlestick breaks below $0.0057, the outlook would shift to bearish. This scenario could lead to a crash of 17% to $0.0047, which is the swing low of April 13.
Information on these pages contains forward-looking statements that involve risks and uncertainties. Markets and instruments profiled on this page are for informational purposes only and should not in any way come across as a recommendation to buy or sell in these assets. You should do your own thorough research before making any investment decisions. FXStreet does not in any way guarantee that this information is free from mistakes, errors, or material misstatements. It also does not guarantee that this information is of a timely nature. Investing in Open Markets involves a great deal of risk, including the loss of all or a portion of your investment, as well as emotional distress. All risks, losses and costs associated with investing, including total loss of principal, are your responsibility. The views and opinions expressed in this article are those of the authors and do not necessarily reflect the official policy or position of FXStreet nor its advertisers. The author will not be held responsible for information that is found at the end of links posted on this page.
If not otherwise explicitly mentioned in the body of the article, at the time of writing, the author has no position in any stock mentioned in this article and no business relationship with any company mentioned. The author has not received compensation for writing this article, other than from FXStreet.
FXStreet and the author do not provide personalized recommendations. The author makes no representations as to the accuracy, completeness, or suitability of this information. FXStreet and the author will not be liable for any errors, omissions or any losses, injuries or damages arising from this information and its display or use. Errors and omissions excepted.
The author and FXStreet are not registered investment advisors and nothing in this article is intended to be investment advice.
Recommended Content
Editors’ Picks

Bitcoin Weekly Forecast: BTC nosedives below $95,000 as spot ETFs record highest daily outflow since launch
Bitcoin price continues to edge down, trading below $95,000 on Friday after declining more than 9% this week. Bitcoin US spot ETFs recorded the highest single-day outflow on Thursday since their launch in January.

Bitcoin crashes to $96,000, altcoins bleed: Top trades for sidelined buyers
Bitcoin (BTC) slipped under the $100,000 milestone and touched the $96,000 level briefly on Friday, a sharp decline that has also hit hard prices of other altcoins and particularly meme coins.

Solana Price Forecast: SOL’s technical outlook and on-chain metrics hint at a double-digit correction
Solana (SOL) price trades in red below $194 on Friday after declining more than 13% this week. The recent downturn has led to $38 million in total liquidations, with over $33 million coming from long positions.

SEC approves Hashdex and Franklin Templeton's combined Bitcoin and Ethereum crypto index ETFs
The SEC approved Hashdex's proposal for a crypto index ETF. The ETF currently features Bitcoin and Ethereum, with possible additions in the future. The agency also approved Franklin Templeton's amendment to its Cboe BZX for a crypto index ETF.

Bitcoin: 2025 outlook brightens on expectations of US pro-crypto policy
Bitcoin (BTC) price has surged more than 140% in 2024, reaching the $100K milestone in early December. The rally was driven by the launch of Bitcoin Spot Exchange Traded Funds (ETFs) in January and the reduced supply following the fourth halving event in April.

Best Forex Brokers with Low Spreads
VERIFIED Low spreads are crucial for reducing trading costs. Explore top Forex brokers offering competitive spreads and high leverage. Compare options for EUR/USD, GBP/USD, USD/JPY, and Gold.