- Render price retested its weekly support around $7.01, bounced 9.5%, and is currently down 0.36% at $7.66.
- On-chain data shows that RNDR capitulation event occurred on June 28.
- A weekly candlestick close below $7.01 would invalidate the bullish thesis.
Render (RNDR) price retested the weekly support level at $7.01, rebounding 9.5% last week. It currently stands at $7.66, with a slight decrease of 0.36% on Monday. On-chain data indicates a capitulation event for RNDR on June 28, accompanied by a decrease in supply on exchanges, suggesting potential for a rally in the coming days.
RNDR shows potential for upside rally amid supply decrease
Render price retested the weekly support level at $7.01 and bounced 9.5% last week. It faces resistance around the next weekly resistance level at $7.96 and trades down 0.36% on the day at $7.66.
Additionally, the weekly support at the $7.01 level roughly coincides with ascending trendline support drawn from joining multiple swing low levels from early November 2023 to late June 2024.
If this support level holds and RNDR closes above $7.96, it could rally 34% to revisit its next weekly resistance level at $10.83.
The Relative Strength Index (RSI) has briefly slipped below the 50 mean level, while the Awesome Oscillator (AO) is on its way to doing the same. If bulls are indeed making a comeback, then both momentum indicators must maintain their positions above their respective mean levels. Such a development would add a tailwind to the recovery rally.
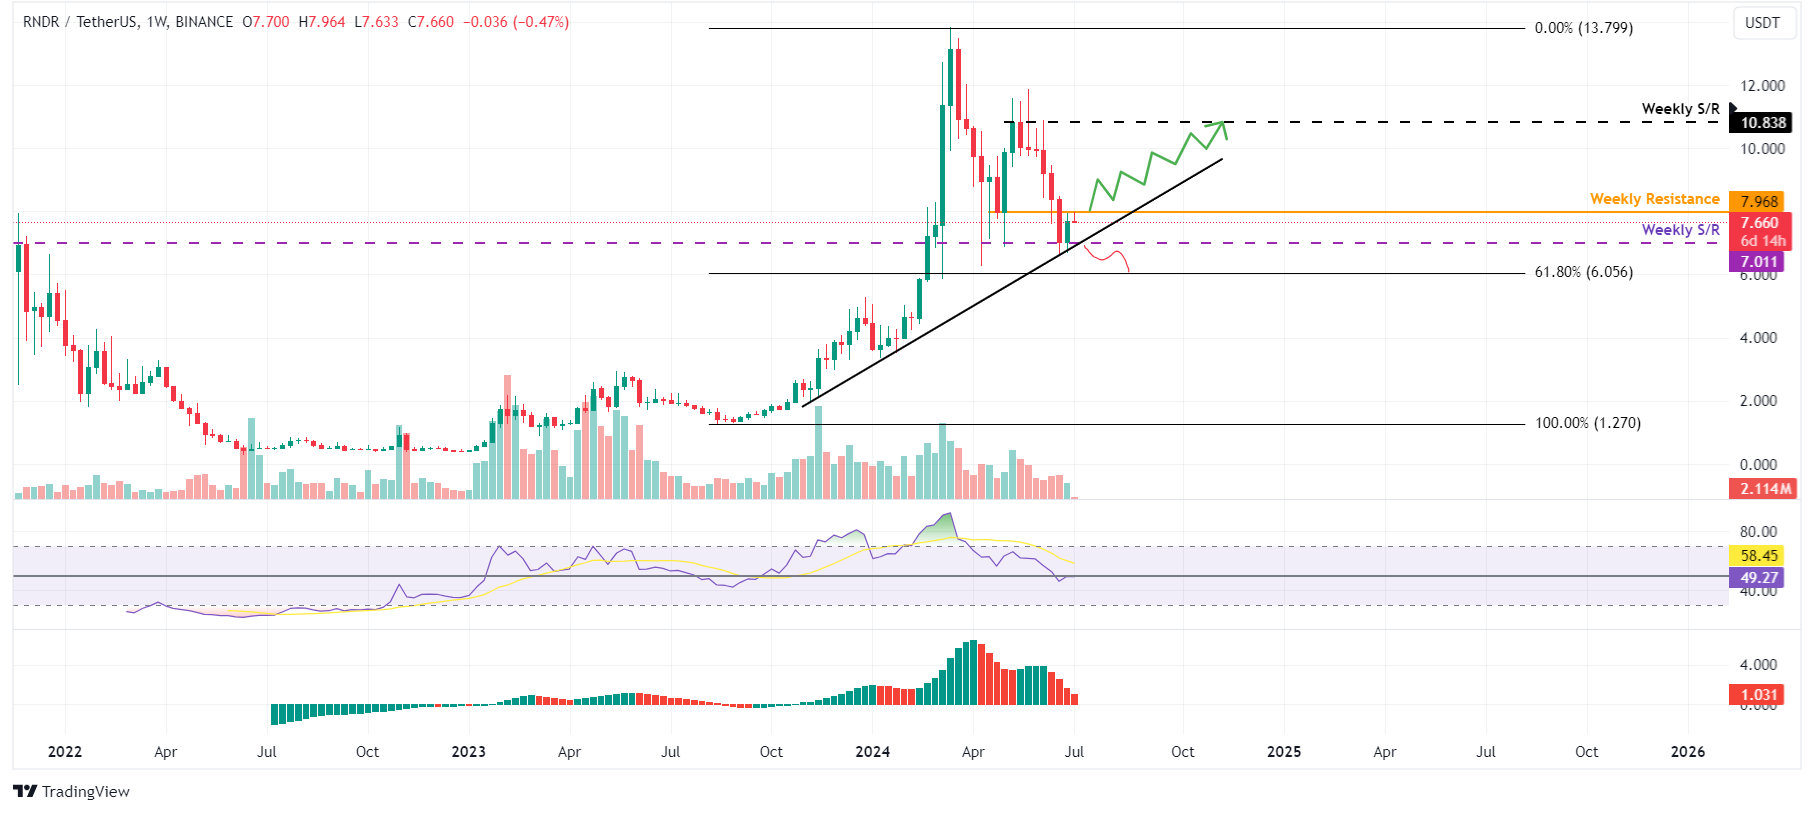
RNDR/USDT weekly chart
Based on IntoTheBlock's In/Out of the Money Around Price (IOMAP), nearly 3,410 addresses accumulated 21.76 million RNDR tokens at an average price of $7.63. These addresses bought the AI-based token between $7.48 and $7.70, which makes it a key support zone. These investors will likely add more to their holdings if the price retraces.
Interestingly, the IOMAP findings coincide with the technical analysis, making the $7.48 to $7.70 zone a key reversal area to watch.
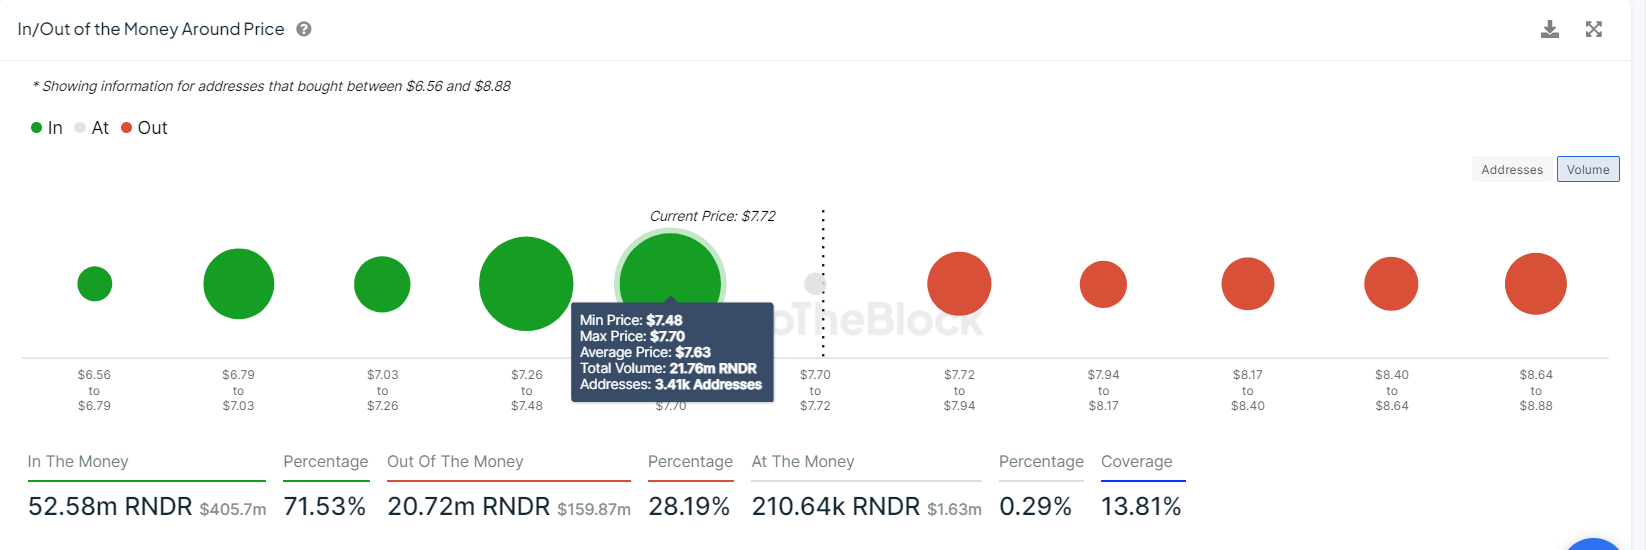
RNDR IOMAP chart
On-chain data provider Santiment’s Network Realized Profit/Loss (NPL) indicator computes a daily network-level Return On Investment (ROI) based on the coin’s on-chain transaction volume. Simply put, it is used to measure market pain. Strong spikes in a coin’s NPL indicate that its holders are, on average, selling their bags at a significant profit. On the other hand, strong dips imply that the coin’s holders are, on average, realizing losses, suggesting panic sell-offs and investor capitulation.
In RNDR’s case, the NPL indicator dipped -49,257 and -23.16 million on June 27 and 28,
coinciding with a 4.6 % price decline. This negative downtick indicates that the holders were, on average, realizing losses.
During this capitulation event, the RNDR’s supply on exchanges declined from 34.46 million to 34.43 million in two days. This decrease in supply on exchanges indicates that the investors are moving RNDR tokens to wallets and reducing selling activity.
%20[13.53.58,%2001%20Jul,%202024]-638554380779096752.png)
RNDR Network Realized Profit/Loss and Supply on Exchanges chart
Even though on-chain metrics and technical analysis point to a bullish outlook, if RNDR's price makes a weekly candlestick close below $7.01, the bullish thesis would be invalidated by creating a lower low on the weekly chart. This development could see Render's price crash by 14% to retest its 61.8% Fibonacci retracement level at $6.05.
Information on these pages contains forward-looking statements that involve risks and uncertainties. Markets and instruments profiled on this page are for informational purposes only and should not in any way come across as a recommendation to buy or sell in these assets. You should do your own thorough research before making any investment decisions. FXStreet does not in any way guarantee that this information is free from mistakes, errors, or material misstatements. It also does not guarantee that this information is of a timely nature. Investing in Open Markets involves a great deal of risk, including the loss of all or a portion of your investment, as well as emotional distress. All risks, losses and costs associated with investing, including total loss of principal, are your responsibility. The views and opinions expressed in this article are those of the authors and do not necessarily reflect the official policy or position of FXStreet nor its advertisers. The author will not be held responsible for information that is found at the end of links posted on this page.
If not otherwise explicitly mentioned in the body of the article, at the time of writing, the author has no position in any stock mentioned in this article and no business relationship with any company mentioned. The author has not received compensation for writing this article, other than from FXStreet.
FXStreet and the author do not provide personalized recommendations. The author makes no representations as to the accuracy, completeness, or suitability of this information. FXStreet and the author will not be liable for any errors, omissions or any losses, injuries or damages arising from this information and its display or use. Errors and omissions excepted.
The author and FXStreet are not registered investment advisors and nothing in this article is intended to be investment advice.
Recommended Content
Editors’ Picks

Polygon joins forces with WSPN to expand stablecoin adoption
WSPN, a stablecoin infrastructure company based in Singapore, has teamed up with Polygon Labs to make its stablecoin, WUSD, more useful in payment and decentralized finance.

Coinbase envisages listing of more meme coins amid regulatory optimism
Donald Trump's expected return to the White House creates excitement in the cryptocurrency sector, especially at Coinbase, the largest US-based crypto exchange. The platform is optimistic that the new administration will focus on regulatory clarity, which could lead to more token listings, including popular meme coins.

Cardano's ADA leaps to 2.5-year high of 90 cents as whale holdings exceed $12B
As Bitcoin (BTC) gets closer to the $100,000 mark for the first time — it crossed $99,000 earlier Friday — capital is rotating into alternative cryptocurrencies, creating a buzz in the broader crypto market.
Shiba Inu holders withdraw 1.67 trillion SHIB tokens from exchange
Shiba Inu trades slightly higher, around $0.000024, on Thursday after declining more than 5% the previous week. SHIB’s on-chain metrics project a bullish outlook as holders accumulate recent dips, and dormant wallets are on the move, all pointing to a recovery in the cards.

Bitcoin: Rally expected to continue as BTC nears $100K
Bitcoin (BTC) reached a new all-time high of $99,419, just inches away from the $100K milestone and has rallied over 9% so far this week. This bullish momentum was supported by the rising Bitcoin spot Exchange Traded Funds (ETF), which accounted for over $2.8 billion inflow until Thursday. BlackRock and Grayscale’s recent launch of the Bitcoin ETF options also fueled the rally this week.

Best Forex Brokers with Low Spreads
VERIFIED Low spreads are crucial for reducing trading costs. Explore top Forex brokers offering competitive spreads and high leverage. Compare options for EUR/USD, GBP/USD, USD/JPY, and Gold.