Render price, like Fetch.ai, could double its gains amid capital inflow from oncoming AI conference
- Render price has recorded a new all-time high of $9.3270, following in the footsteps of sector peer Fetch.ai.
- When FET broke its previous ATH last week, it took just over seven days to hit a double.
- RNDR could extend 50% to tag $14.0000 psychological level ahead of NVIDIA conference.

A break and close below $6.8750 would create a lower low, thereby invalidating the bullish thesis.
After the recent meme coin mania that saw sector tokens register double-digit gains, AI crypto coins are the latest euphoria ahead of the NVIDIA 2024 GTC AI conference scheduled for March 18 to 21 in Silicon Valley.
Also Read: AI tokens dip before NVIDIA 2024 GTC AI conference: RNDR, FET, AGIX, AKT
AI crypto coins rally ahead of AI conference
AI crypto coins are rallying after providing a buying opportunity on Tuesday. It comes amid the “buy the rumor” situation ahead of the NVIDIA 2024 GTC AI conference, advertised as the largest AI conference hosted by the technology firm. As this is an important event expected to feature over 900 sessions and 300 exhibits, AI crypto coins are benefiting the most as seen with the ongoing buying frenzy.
Amid this euphoria, one trader @TheFlowHorse on X, observes that “when FET broke [its] all-time high, it took just over a week to hit a double.” The same excitement could manifest for the Render Network token (RNDR).
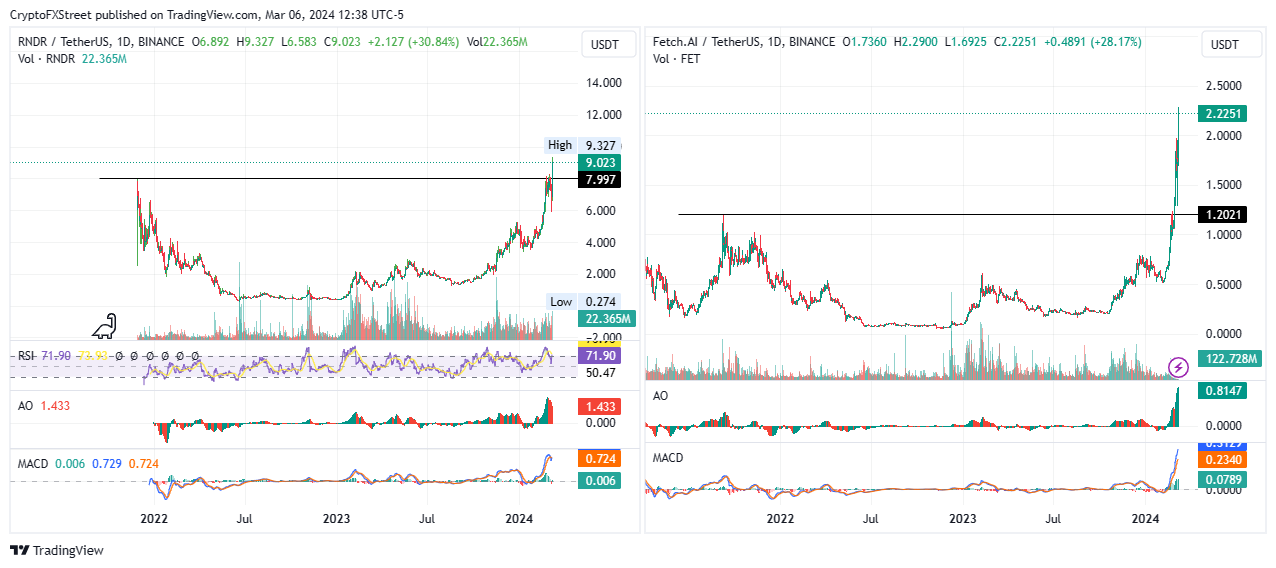
RNDR/USDT 1-day chart, FET/USDt 1-day chart
Meanwhile, as altcoins continue to break all-time highs, Bitcoin price is consolidating below its own amid ongoing capital rotation.
Incredible times, #Altcoins already breaking all-time highs, while #Bitcoin is consolidating beneath one.
— Michaël van de Poppe (@CryptoMichNL) March 6, 2024
And we’re just a the start of the cycle.
Render price outlook ahead of the AI conference
Render price still has more ground to cover after clearing previous peaks and could reclaim the $9.7690 level soon as indicated by the rising Relative Strength Index (RSI). If this trajectory of the momentum indicator is sustained, the RSI could soon execute a buy signal, enhancing the rally.
The Moving Average Convergence Divergence (MACD) is also northbound after executing a bullish buy signal when it crossed above the orange band (signal line).
Enhanced buyer momentum could see the Render price clear the $9.7690 roadblock before nicking the $10.0000 psychological level. In a highly bullish case, RNDR price could extend a neck higher toward the $14.0000 psychological level. Such a move would constitute a nearly 50% climb above current levels.
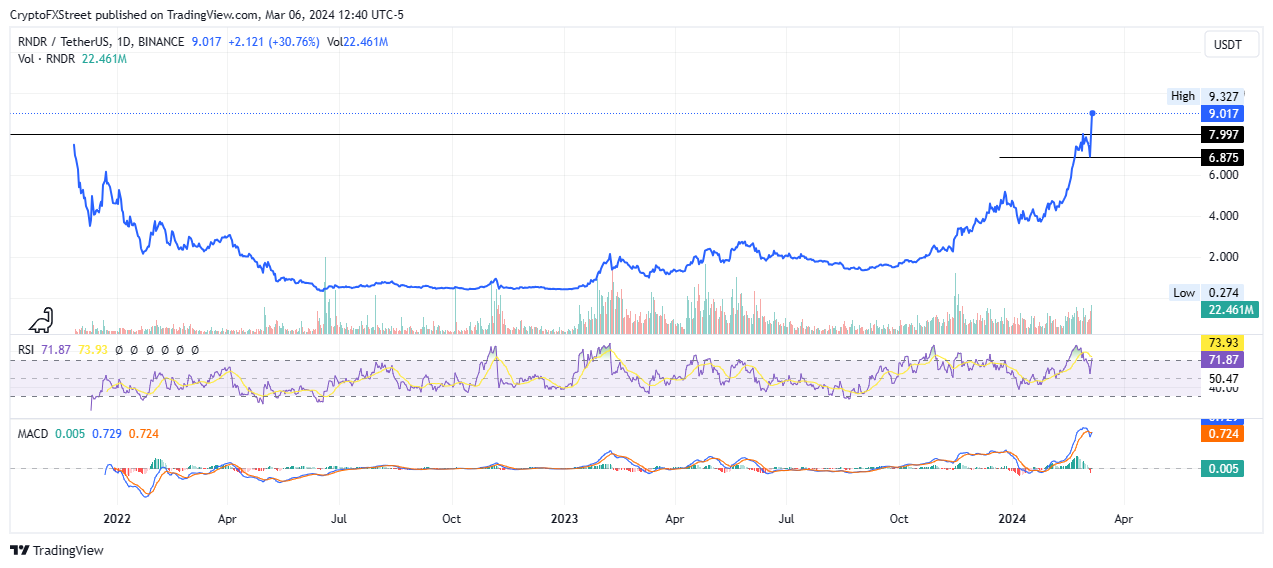
RNDR/USDT 1-day chart
On the other hand, if early profit booking sets in, Render price could drop, falling back below the $7.9970 support. In a dire case, the ensuing slump could descend toward the $6.8750 support. A break and close below this level would invalidate the bullish thesis.
Author

Lockridge Okoth
FXStreet
Lockridge is a believer in the transformative power of crypto and the blockchain industry.


