Ren Technical Analysis: REN’s splendid recovery stalls as bears swing into action
- Ren resumes the downtrend after running into tough resistance at $0.25.
- Multiple on-chain metrics suggest that the path of least resistance is downwards.
- Support between $0.22 and $0.225 will come in handy if declines progress.

Ren is among the few cryptocurrencies that sustained an uptrend in the last week. Before the recovery, a breakdown that came into the picture in the first week of September saw the token explore the rabbit hole to lows of $0.16. A reversal on September 20 sent REN/USD piercing through various resistance zones, including $0.20 and $0.24. Unfortunately, the majestic spike ground into a halt beneath $0.25.
Ren network overview
Ren is an open protocol that exists to provide inter-blockchain liquidity for decentralized applications in the industry. The platform gives users flexibility, in that they can transfer any token to any blockchain. In other words, users do not need to think about the complexities of wrapping or unwrapping tokens. At the same time, they can “access tokens from any blockchain using existing smart contracts.”
Ren embarks on another retreat
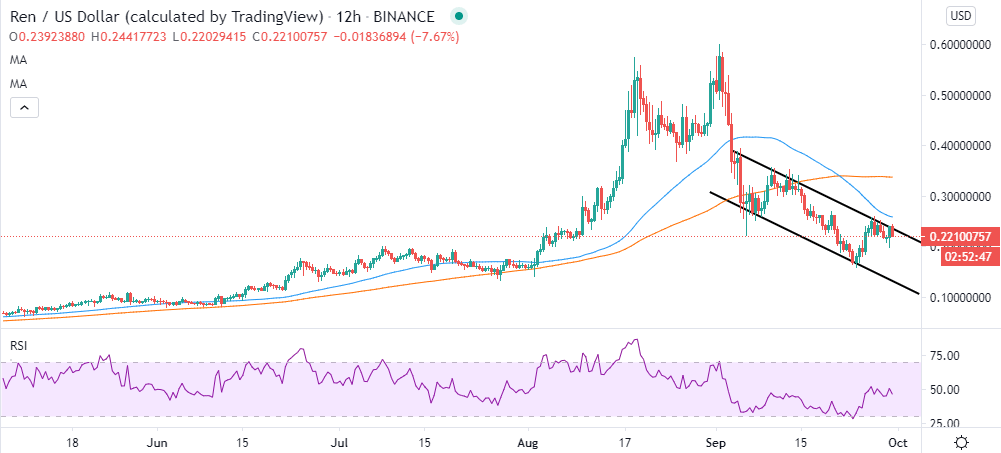
After hitting a barrier at $0.25, Ren has started to fall back. The cryptocurrency is currently dealing with the resistance of a parallel descending channel. If the channel confirms into a bull flag, Ren could eventually plummet towards the critical support at $0.20 and $0.16.
The Relative Strength Index (RSI), although not oversold, is retreating, highlighting the growing influence of the bears over the price. In the event the downward motion continues below the midline, REN will stick to the downtrend. Nonetheless, support is envisaged at $0.20 and $0.16, respectively.
REN/USD 12-hour chart
IntoTheBlock’s IOMAP metric shows that REN is sitting on areas with immense support. The most robust support lies in the range, $0.22 and $0.225. Previously, about 350 addresses bought approximately 67 million REN. The range appears to have what it takes to absorb most of the selling pressure. On the upside, the only hurdle delaying the continuation of the uptrend lies between $0.225 and $0.228. Here, 213 addresses previously purchased roughly 22 million REN. If this level flips into support, Ren could relaunch the journey of breaking barriers, targeting $0.25.
Ren IOMAP chart
-637370538295378791.png)
Looking into Santiment’s Daily Active Deposits metric, we can see that REN’s amount to exchanges has started to decline. The days between September 20 and 25 recorded a spike in daily REN deposits into exchanges. The inflow into the exchanges reflected in the price as it rallied to $0.25. As the deposits start to thin, the price is expected to continue falling in the near term.
Ren daily active deposits chart
 Daily Active Deposits-637370538664310013.png)
Consequently, Santiment also shows that whales have started slowing down on the uptake of REN. The selling pressure is vividly brought into the picture by the decreasing number of addresses holding between 100,000 and 1,000,000 REN. These addresses currently stand at 522 from 531, posted on September 25. If this selling pressure increases, REN is likely to dive further.
Ren holder distribution chart
 hokder distribution-637370539250731509.png)
Similarly, the daily active addresses within the Ren network are also on retreat. The decline comes after a peak on September 25 when the addresses hit 875. The number of active addresses has tanked to 158 at the time of writing. A decrease in the number of addresses suggests that investors are paying less attention to REN. The metric also highlights drab near future with price dips in the offing.
Ren daily active addresses chart
 Daily active addresses-637370539809828317.png)
Looking at the other side of the picture
Ren is in the middle of a retreat after hitting a barrier at $0.25. The token is trading at $0.2240 while battling the resistance at the parallel descending channel. A glance higher shines a light on another hurdle presented by the 50 Simple Moving Average (SMA) in the hourly range. Flipping this moving average into support could invalidate the bearish outlook and place Ren on the original uptrend, eying $0.30. The possibility of a recovery also exists if the descending channel does not confirm a bear flag.
Author

John Isige
FXStreet
John Isige is a seasoned cryptocurrency journalist and markets analyst committed to delivering high-quality, actionable insights tailored to traders, investors, and crypto enthusiasts. He enjoys deep dives into emerging Web3 tren


