Ren Technical Analysis: REN has clear a path to $0.4
- Ren price breaks out as trading debuts on Coinbase.
- Ren’s bullish narrative is also supported by a surge in on-chain activity as whales continue increasing their holdings.
- The resistance at $0.28 and $0.30 must come down for gains towards $0.4 to materialize.

Ren embarked on a new retreat at the beginning of October, a move that extended the downtrend from the all-time high traded at $0.60. Support established at the $0.20 allowed bulls to find balance. A recovery came into the picture with the decentralized finance (DeFi) token hitting higher levels at $0.26. In the meantime, REN/USD is dancing at $0.259, following more than 10% in gains accrued over the last 24 hours.
Ren trading now live on Coinbase
Ren is leading the recovery in the DeFi sector following the listing on Coinbase. The San Francisco-based cryptocurrency exchange added Ren (REN) support and Balancer (BAL), breathing some fresh air into the projects. The trading started on Wednesday after the liquidity threshold was achieved. According to Coinbase on Twitter, buying and selling the token has been supported on Coinbase.com, iOS and Android apps.
Exploring REN/USD bullish case
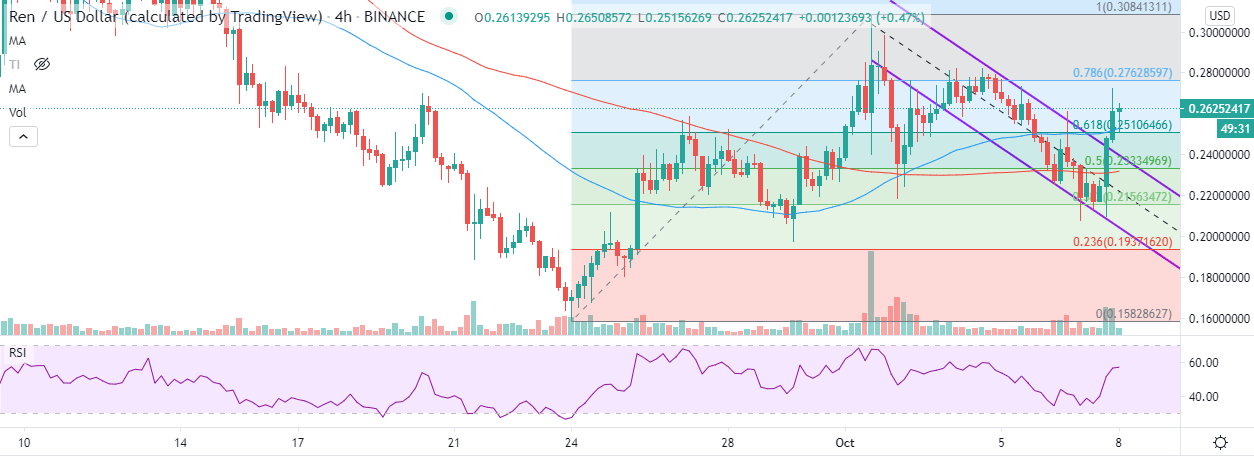
Ren hit the rail tracks following the live trading on Coinbase. The spike broke out of a descending parallel channel and the 50 Simple Moving Average (SMA). It also stretched past the 61.8% Fibonacci retracement level taken between the last swing high of $0.3084 to swing low of $0.1582. The uptrend, mainly supported by a surge in the volume, stepped above $0.26 but stalled under the short term hurdle at $0.28.
REN is still in the hands of the bulls, despite the listing news settling. The Relative Strength Index (RSI) sharply recovered from levels closer to the oversold, emphasizing the buying pressure. On the upside, buyers have eyes on $0.28 and $0.30 hurdles, respectively. If this seller congestion zone is flipped into support, the DeFi token will commence the journey to $0.4. On the downside, initial support is highlighted by the 50 SMA, the 61.8% Fibonacci level, the 100 SMA, and $0.22.
REN/USD 4-hour chart
According to on-chain data by Santiment, Ren’s bullish narrative is not only because of the listing on Coinbase but the increase in on-chain activity. The amount held by top-non exchange addresses has increased significantly over the last two weeks. On September 23, the holdings stood roughly at 402 million REN, but at the moment, these addresses hold approximately 411 million REN. As the accumulation surges, buying pressure behind the token is also bound to rise, in turn, supporting REN/USD recovery towards the all-time high.
Ren amount held by top-non exchange addresses
 top-non-exchange holders-637377267631992718.png)
Simultaneously, whales holding between 1 million and 10 million REN have also been on a buying spree. The addresses within this range shot up from 61 on September 28 to 61 on October 8. This growth may seem insignificant, but the volume carried by these whales is massive. However, the chart is starting to print a bearish picture, perhaps due to some whales selling to capitalize on the bullish movement in the last 24 hours.
Ren holder distribution chart
 [06.32.53, 08 Oct, 2020]-637377268448149578.png)
Looking at the other side of the fence
It is worth mentioning that selling pressure is still present in the market. Therefore, gains above $0.28 and $0.30 will help secure Ren’s bullish case to $0.4. However, if the hurdle at $0.28 remains intact, bears will swing into action with a mission to erase the gains posted in the last 24 hours. On the downside, support at $0.24 will come in handy to stop losses towards $0.22.
Author

John Isige
FXStreet
John Isige is a seasoned cryptocurrency journalist and markets analyst committed to delivering high-quality, actionable insights tailored to traders, investors, and crypto enthusiasts. He enjoys deep dives into emerging Web3 tren


