- Pyth Network price could slide another 8% before it stabilizes around the $0.427 support level.
- Deviation below $0.427 is likely, but a quick recovery could open the path for an 80% upswing to $0.759.
- A breakdown of the $0.370 support level will invalidate the bullish thesis.
Pyth Network (PYTH) price rallied nearly 50% between February 1 and 2 due to a sudden spike in buying pressure. However, the altcoin is undergoing correction to find a stable support level.
Also read: Bitcoin Weekly Forecast: BTC price remains indecisive despite strong fundamentals
Pyth Network price sets the stage for next leg
Pyth Network price consolidated for 11 days between January 21 and February 1 below $0.427. The breakout on February 2 led to a nearly 50% rally, but profit-taking reduced the total gains to 25% on candlestick closes.
Currently, Pyth Network price is retracing and is likely going to settle around $0.427. While there could be fluke deviations below this level, investors should not get shaken out. Instead, traders should watch for a quick recovery above $0.427. If successful, Pyth Network price could be setting the stage for the next run-up.
In this case, investors can expect the potential upswing to face a slowdown around the $0.491 and $0.518 resistance levels. But a decisive flip of these hurdles into a foothold will open the path for PYTH to rally 47% and $0.759.
This move would constitute a nearly 80% gain from $0.427.
Also read: Etheruem price rise remains restricted as “billionaire” wallets now hold a third of ETH tokens
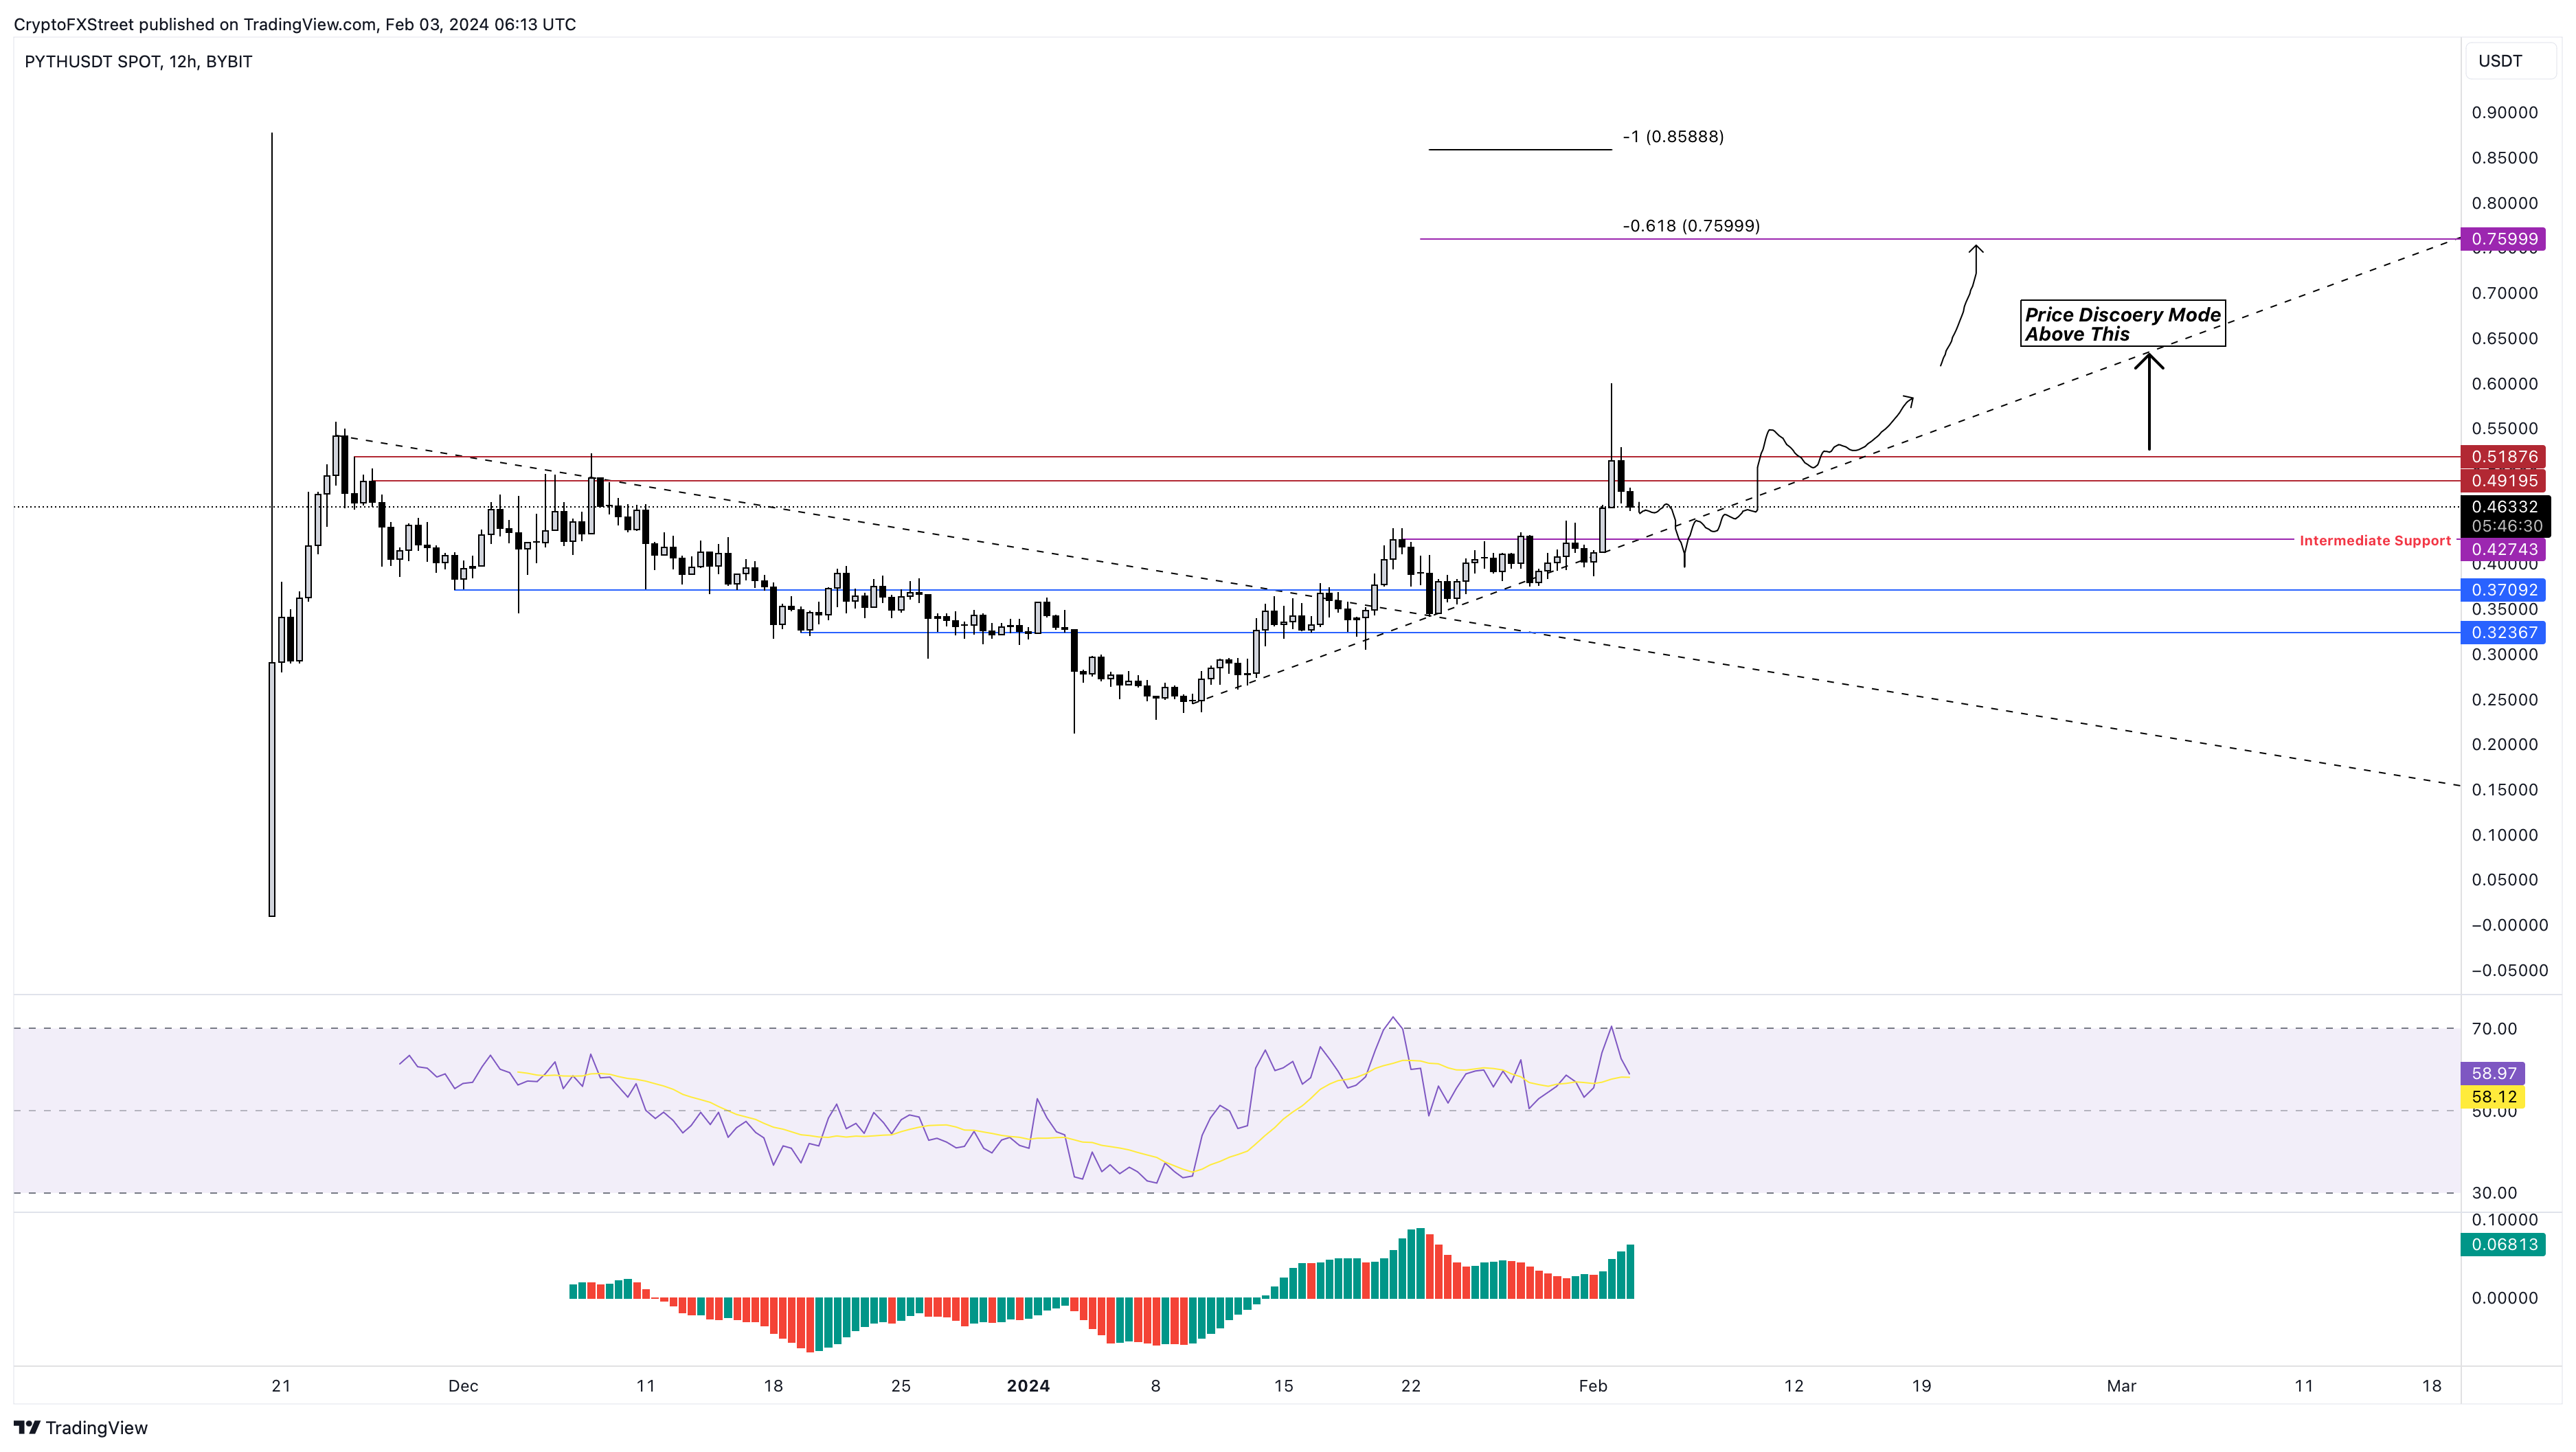
PYTH/USDT 12-hour chart
Regardless of the extremely bullish outlook, Pyth Network price could fail to hold above $0.427 due to the current market conditions. In some cases, the deviation could occur below $0.370 as well. But a decisive twelve-hour candlestick close below $0.370 will invalidate the bullish thesis for PYTH.
This development could see Pyth Network price crash 12% and tag $0.323.
Also read: Lido DAO Price Prediction: LDO could fall 20% with the weekly supply zone holding as resistance
Information on these pages contains forward-looking statements that involve risks and uncertainties. Markets and instruments profiled on this page are for informational purposes only and should not in any way come across as a recommendation to buy or sell in these assets. You should do your own thorough research before making any investment decisions. FXStreet does not in any way guarantee that this information is free from mistakes, errors, or material misstatements. It also does not guarantee that this information is of a timely nature. Investing in Open Markets involves a great deal of risk, including the loss of all or a portion of your investment, as well as emotional distress. All risks, losses and costs associated with investing, including total loss of principal, are your responsibility. The views and opinions expressed in this article are those of the authors and do not necessarily reflect the official policy or position of FXStreet nor its advertisers. The author will not be held responsible for information that is found at the end of links posted on this page.
If not otherwise explicitly mentioned in the body of the article, at the time of writing, the author has no position in any stock mentioned in this article and no business relationship with any company mentioned. The author has not received compensation for writing this article, other than from FXStreet.
FXStreet and the author do not provide personalized recommendations. The author makes no representations as to the accuracy, completeness, or suitability of this information. FXStreet and the author will not be liable for any errors, omissions or any losses, injuries or damages arising from this information and its display or use. Errors and omissions excepted.
The author and FXStreet are not registered investment advisors and nothing in this article is intended to be investment advice.
Recommended Content
Editors’ Picks

Shiba Inu eyes positive returns in April as SHIB price inches towards $0.000015
Shiba Inu's on-chain metrics reveal robust adoption, as addresses with balances surge to 1.4 million. Shiba Inu's returns stand at a solid 14.4% so far in April, poised to snap a three-month bearish trend from earlier this year.

AI tokens TAO, FET, AI16Z surge despite NVIDIA excluding crypto-related projects from its Inception program
AI tokens, including Bittensor and Artificial Superintelligence Alliance, climbed this week, with ai16z still extending gains at the time of writing on Friday. The uptick in prices of AI tokens reflects a broader bullish sentiment across the cryptocurrency market.

Bitcoin Weekly Forecast: BTC consolidates after posting over 10% weekly surge
Bitcoin price is consolidating around $94,000 at the time of writing on Friday, holding onto the recent 10% increase seen earlier this week. This week’s rally was supported by strong institutional demand, as US spot ETFs recorded a total inflow of $2.68 billion until Thursday.

XRP price could renew 25% breakout bid on surging institutional and retail adoption
Ripple price consolidates, trading at $2.18 at the time of writing on Friday, following mid-week gains to $2.30. The rejection from this weekly high led to the price of XRP dropping to the previous day’s low at $2.11, followed by a minor reversal.
Bitcoin Weekly Forecast: BTC consolidates after posting over 10% weekly surge
Bitcoin (BTC) price is consolidating around $94,000 at the time of writing on Friday, holding onto the recent 10% increase seen earlier this week.

The Best brokers to trade EUR/USD
SPONSORED Discover the top brokers for trading EUR/USD in 2025. Our list features brokers with competitive spreads, fast execution, and powerful platforms. Whether you're a beginner or an expert, find the right partner to navigate the dynamic Forex market.