Polygon’s MATIC price hits a brick wall; here’s why another downswing is very likely
- Polygon price outlier in front footed cryptocurrency market.
- MATIC price eyes risk to the downside as bulls are scared to engage with bearish pressure nearby.
- Expect to see a test to the upside around $0.700 before MATIC price drops back to $0.620.

Polygon (MATIC) price is a bit of an outlier today as all major cryptocurrencies are tying up gains after market’s welcomed some supportive measures from the Chinese central bank. Storming out of the gate in the ASIA PAC session, equities made some considerable gains, ignoring all the tail risks present. MATIC price is going against the grain somewhat as it moves sideways-to-lower as bulls see no point in engaging with a strong red descending trend line that is still keeping price action pinned down.
MATIC price sees bulls sidelined as risk appetite disappears
Polygon price is still under the scrutiny of the longer-term descending trend line that has set the tone these past few weeks. Although equity markets were rallying sharply this morning in the ASIA PAC session, Polygon investors are letting the train pass them by as they see no point in engaging because the red descending trend line provides a prominent bearish force. The sidelining of bulls is represented by the Relative Strength Index (RSI) too, which is flatlining, pointing to an equilibrium between bears and bulls for now.
MATIC price will need bigger catalysts to get underneath the red descending trend line and then break above it. For now, expect bearish sentiment and the overall downtrend to weigh still, and push the price back to $0.62, increasing pressure for a bearish triangle to complete. By this, Polygon price is set to tank another 15% to 26% by next week if $0.62 and $0.545 do not hold as support.
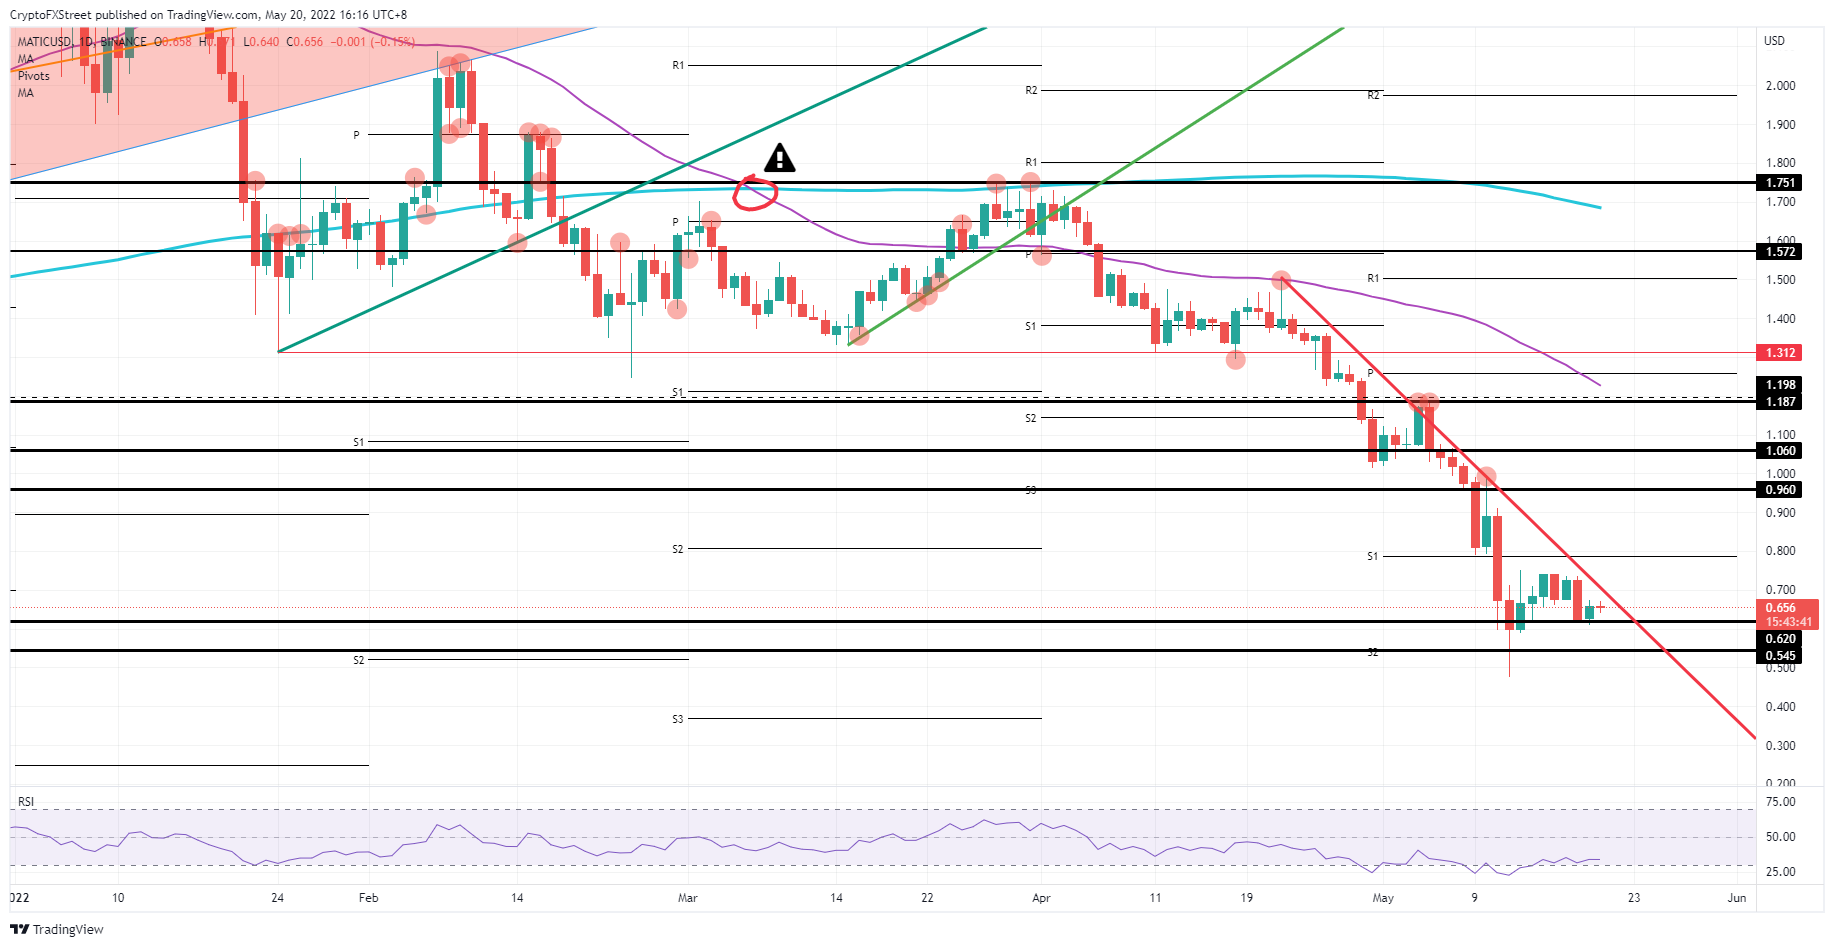
MATIC/USD daily chart
In case a positive catalyst emerges today, expect to see a big jump to the upside, with MATIC price piercing through the red descending trend line and an influx of traders awaiting that clear break. Expect Polygon price to rally up towards $0.80 with the monthly S1 in the way and acting as a starting point for the next leg up towards $0.96, followed by a possible glance at $1.00. Although that would depend on the size and impact of the catalyst at hand.
Author

Filip Lagaart
FXStreet
Filip Lagaart is a former sales/trader with over 15 years of financial markets expertise under its belt.


