Polygon Price Forecast: MATIC price exhausted as no new impulse arrives
- Polygon price still ties up with gains from Monday trading.
- MATIC shows signs of issues underneath as indicators point to a cool-down need.
- Expect a fade soon toward support before ticking $1.20 to the upside.

Polygon (MATIC) price action has started to trade sideways as markets are starting to second-guess their idea of a Goldilocks scenario. After the dislocation has been ramping up between what central bank speakers were saying and how markets were trading the comments, that dislocation seems to have reached a boiling point. With the US and British central banks set to kick off the financial year on February 1st and 2nd, a few bulls are starting to second guess if they were not too eager too soon
Polygon price shows signs of second-guessing
Polygon price for a fourth day in a row cannot trade away from the monthly R2 resistance level near $1.02. As such, the sideways pattern is welcomed as the speed of the rally was going too hard for some bulls, and a cool-down is needed. Every market guru will tell you that trading is a marathon, not a sprint, thus the signs need to be respected or severe casualties are set to happen if this rally continues at this pace.
Luckily, MATIC can trade back below the overbought barrier on the Relative Strength Index but is not seeing signs of a cool-down either. The risk is that bulls are starting to second-guess whether it was wise to jump into this rally and defy the central banks set to come out with prospects and new information at the start of February. Expect to see some risk being limited, with selling positions and support at $0.96 to hold support before price action can rally higher toward $1.20 and print 23% gains in the next leg of this recovery rally near March.
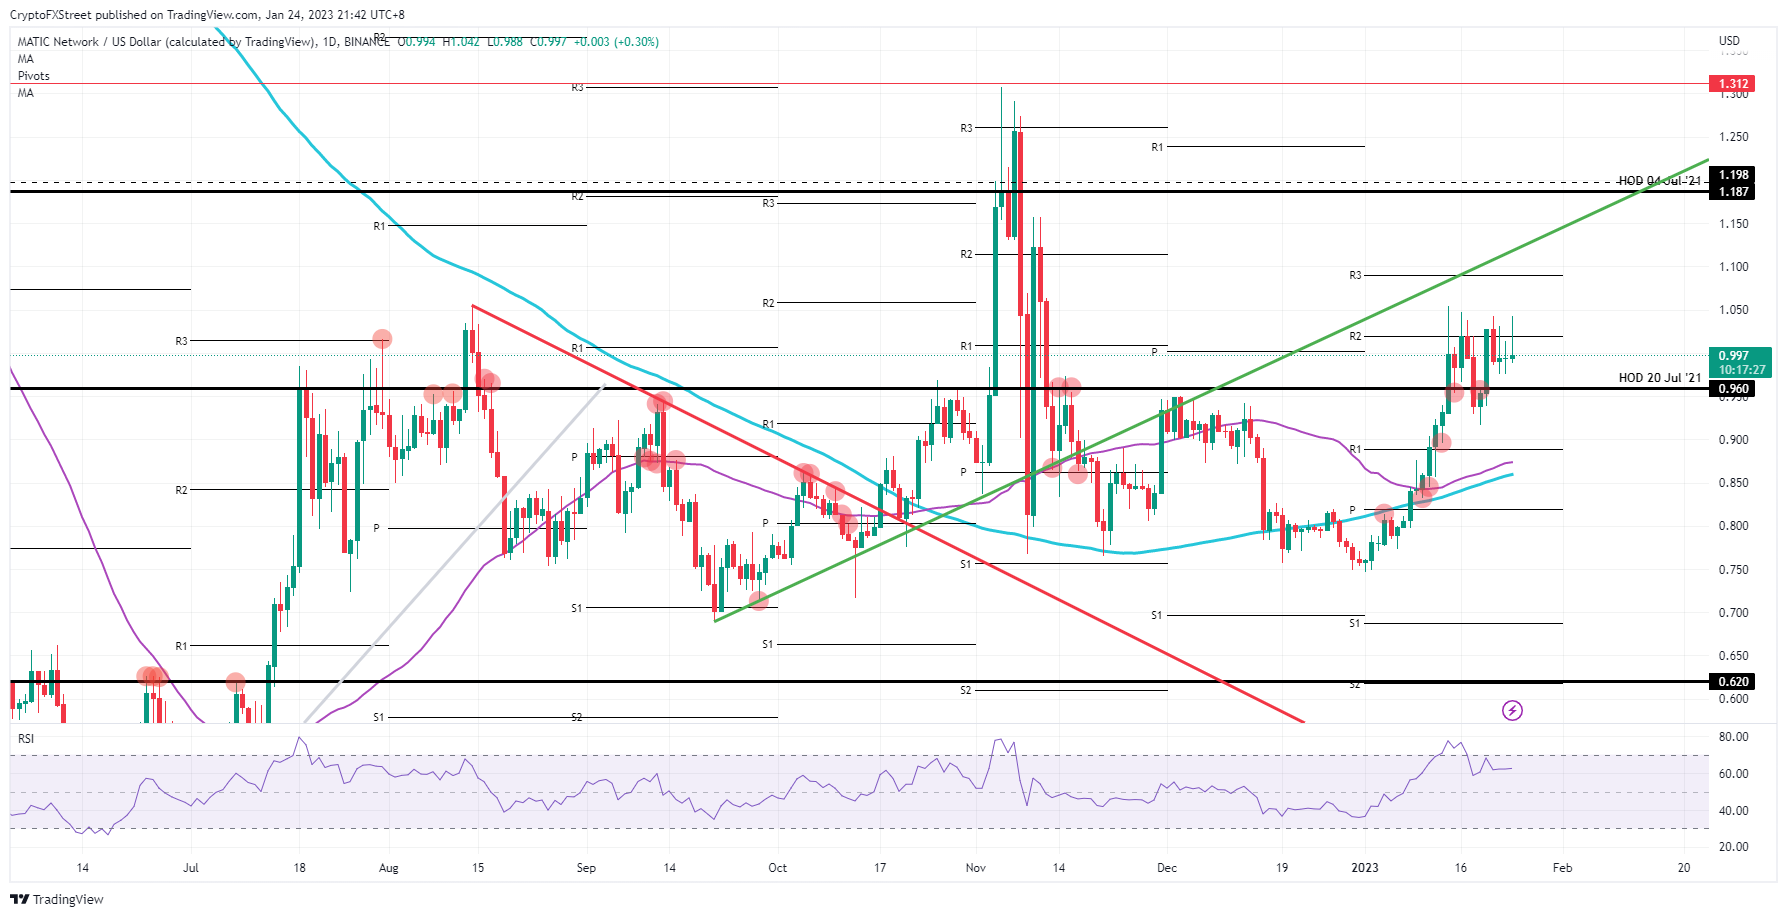
MATIC/USD daily chart
In case that fade breaks below the support of $0.96, the risk is that bears flock into that break and run price action into the ground. For now, bears have been sidelined, but if the US Fed comes with a surprise or the BoE confirms a recession on its hands, expect a shock to go through the markets as that earlier mentioned dislocation needs to be unwound. Polygon price would tank back below $1 and find double support of the 55-day Simple Moving Average and the 200-day SMA near $0.86.
Author

Filip Lagaart
FXStreet
Filip Lagaart is a former sales/trader with over 15 years of financial markets expertise under its belt.


