Polygon price action is set to drop to $0.75 as MATIC no match against the greenback
- Polygon price action sees US job numbers spoiling its plan to break out of pennant.
- MATIC price is set to drop back below the 55-day SMA.
- Expect to see further losses eked out towards $0.75, still in respect of the pennant.

Polygon (MATIC) price action sees bulls fleeing the scene as the US dollar roars again. Several assets are devaluing as there seems to be only one big winner this financial year, which is the greenback. The strong dollar has already burned through a billion of market cap in cryptocurrencies, and at this pace, it could add another billion by the end of this year.
MATIC price at one point will have no buyers left
Polygon price action was set to go out the week with a bang of 13% gains for investors. As equity investors run for the hills, commodities hang in the ropes, bonds are sold like a fire sale, and cryptocurrencies are getting hammered against the stronger dollar. MATIC price action is set to already erase 3% of its 13% gains, and the rest by the end of the US trading session.
MATIC price, thus, will remain within the boundaries of the pennant price pattern on the charts and looks set to drop below the 55-day Simple Moving Average (SMA), making it difficult for bulls to make another run for a bullish breakout. Expect to see a drop back towards $0.75 in a downside test of the pennant depending on whether bulls are willing to defend. If bulls are reluctant to fight the mighty dollar, another leg lower would see MATIC price printing at $0.70 or lower.
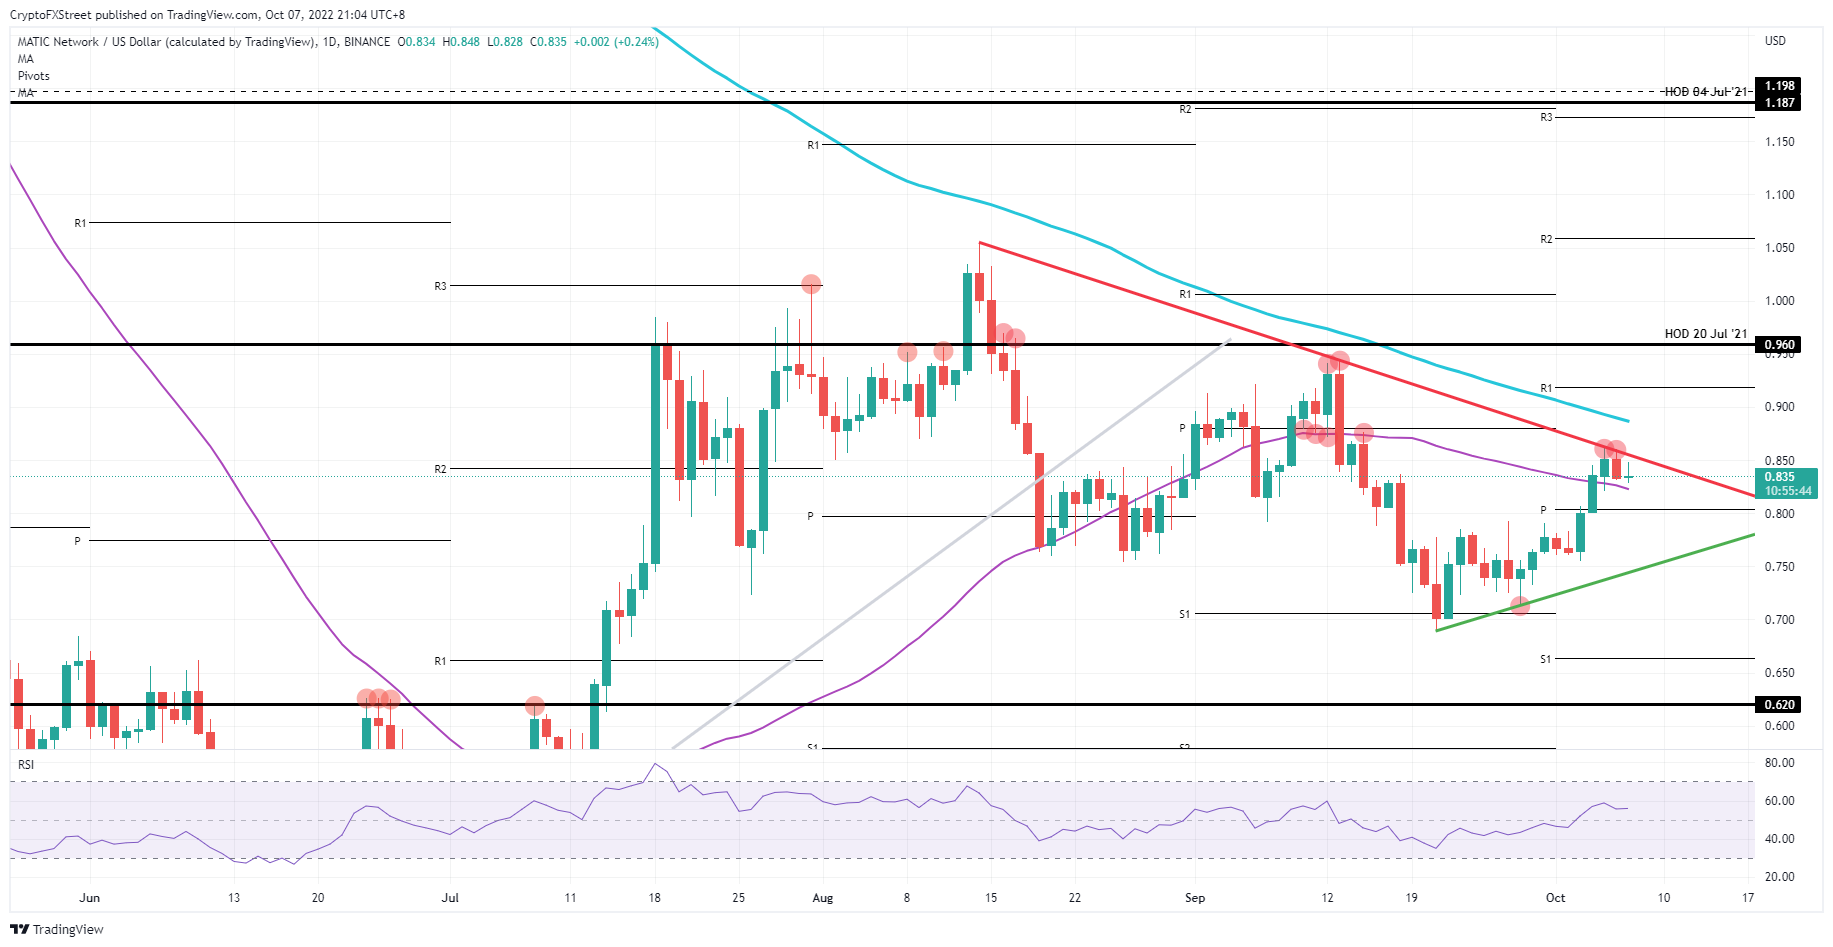
MATIC/USD Daily chart
Should the 55-day SMA still hold and withstand the selling pressure, however, bears could be set up to be trapped, and bulls could use that as leverage to force a squeeze to the upside. A bullish breakout out of the pennant could then unfold and see MATIC print at $0.886. A false break at $0.90 could even be in the cards before a fade and pullback below the 200-day SMA materialises.
Author

Filip Lagaart
FXStreet
Filip Lagaart is a former sales/trader with over 15 years of financial markets expertise under its belt.


