Polkadot's new roadmap is the lifeline of a potential DOT price rally
- DOT price is ready for a 180 degrees turnaround to $6.50 and $8.00.
- Polkadot's founder, asynchronous rob, releases a new roadmap for the ecosystem's fourth quarter in 2022.
- Scalability tops Polkadot's priority list, especially from the developers' perspective.

Polkadot is in the process of cultivating a bullish breakout from a recently formed technical pattern. The parachain token took a breather at $6.30 after encountering strong seller congestion at $6.50. In the meantime, a four-hour to a daily close above the 50-day SMA (Simple Moving Average) is required to cement the bulls' presence in the market.
Meet Polkadot's new roadmap
Polkadot is not slowing down on its development activities, especially now that its founder, asynchronous rob, has released a new roadmap specifically for the fourth quarter of 2022. The development plan touches on a number of categories, including parachain scalability, parachain development, relay-chain governance, cross-chain communication, direct bridges to other ecosystems, common-good parachains and staking.
Scalability comes high on the project's priority list. According to asynchronous rob, "the goal of Parity and the Web3 Foundation as protocol designers is to meet the demand of parachains by providing each parachain with a large increase in block capacity." The team is working around the clock to ensure that Asynchronous Backing is ready for deployment on Kusama, Polkadot's research ecosystem, by the end of 2022.
DOT price prints a bullish move
Polkadot price is reaching for a breakout from a short-term falling wedge pattern. Support provided by the 50-day SMA on the four-hour chart has allowed buyers to worry less about sudden pullbacks but channel their efforts on regaining the ground to $6.50 and even $8.00.
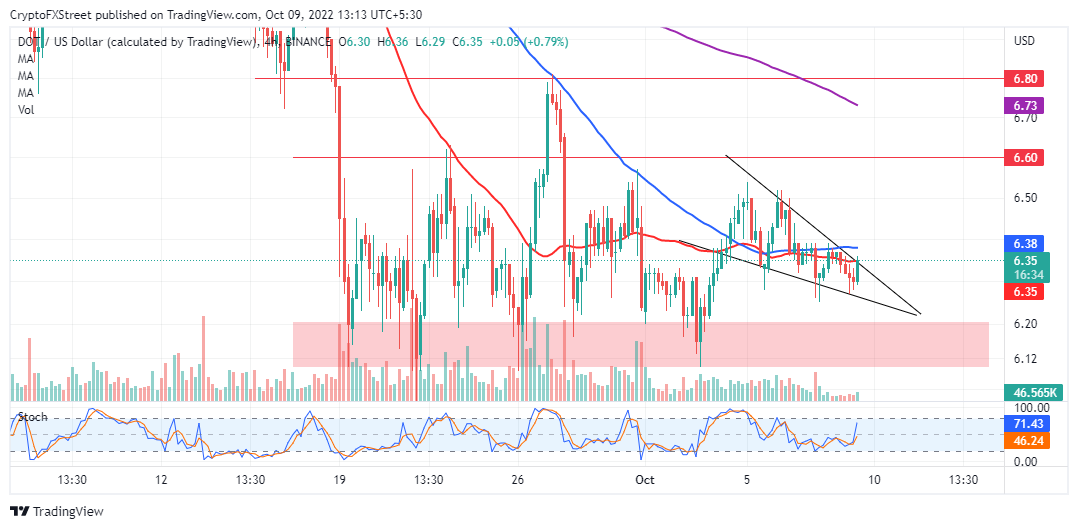
DOT/USD four-hour chart
A falling wedge pattern forms after a significant downward movement in price followed by a consolidation period. Two trend lines connect a series of lower highs and lower lows. A breakout is often expected as DOT price slides further into the apex.
To make the most out of the wedge pattern while avoiding bull traps, traders must confirm a breakout above the upper trend line. Potential take profit targets to the upside lie at $6.50 and $8.00, respectively.
On the other hand, the Stochastic oscillator on the same chart reveals Polkadot price is almost becoming overbought. In other words, short-term trades may favor sellers, which could discourage buyers from trying to push DOT up the ladder. In case of a trend correction, support areas likely to be tested are $6.20 and $6.12, respectively.
Author

John Isige
FXStreet
John Isige is a seasoned cryptocurrency journalist and markets analyst committed to delivering high-quality, actionable insights tailored to traders, investors, and crypto enthusiasts. He enjoys deep dives into emerging Web3 tren


