- Polkadot price saw a 33% upswing on October 13 and set up a swing high at $44.84.
- Investors can expect DOT to retrace to the $35.48 to $38.76 demand zone before rallying higher.
- A breakdown of the 50% Fibonacci retracement level at $30.14 will invalidate the bullish thesis.
Polkadot price formed a triple tap set up between September 7 and September 29, triggering a massive uptrend. DOT set up a new swing high as a result and is currently mapping its next moves.
Polkadot price loads ammo for next leg-up
Polkadot price rose a whopping 71% between September 29 and October 16, setting up the third higher high at $44.84. This run-up was exhaustive as it has given rise to a consolidation phase.
Investors can expect DOT to retrace at least 10% to retest the demand zone ranging from $35.48 to $38.76. A dip into this support area will allow the buyers who rode the recent run-up to book profit and provide the sidelined investors an opportunity to accumulate for the next leg-up.
However, Polkadot price needs to stay above this area. Such a situation sets up DOT for another leg-up to retest the range high at $50.04.
A decisive close above this level will open the path for a new all-time high at $53.88m, coinciding with the 100% trend-based Fibonacci extension level.
If the buying pressure persists, Polkadot price could continue its ascent to 161.8% level at $71.4. This climb would represent a 68% ascent from the current position and would be a new all-time high.
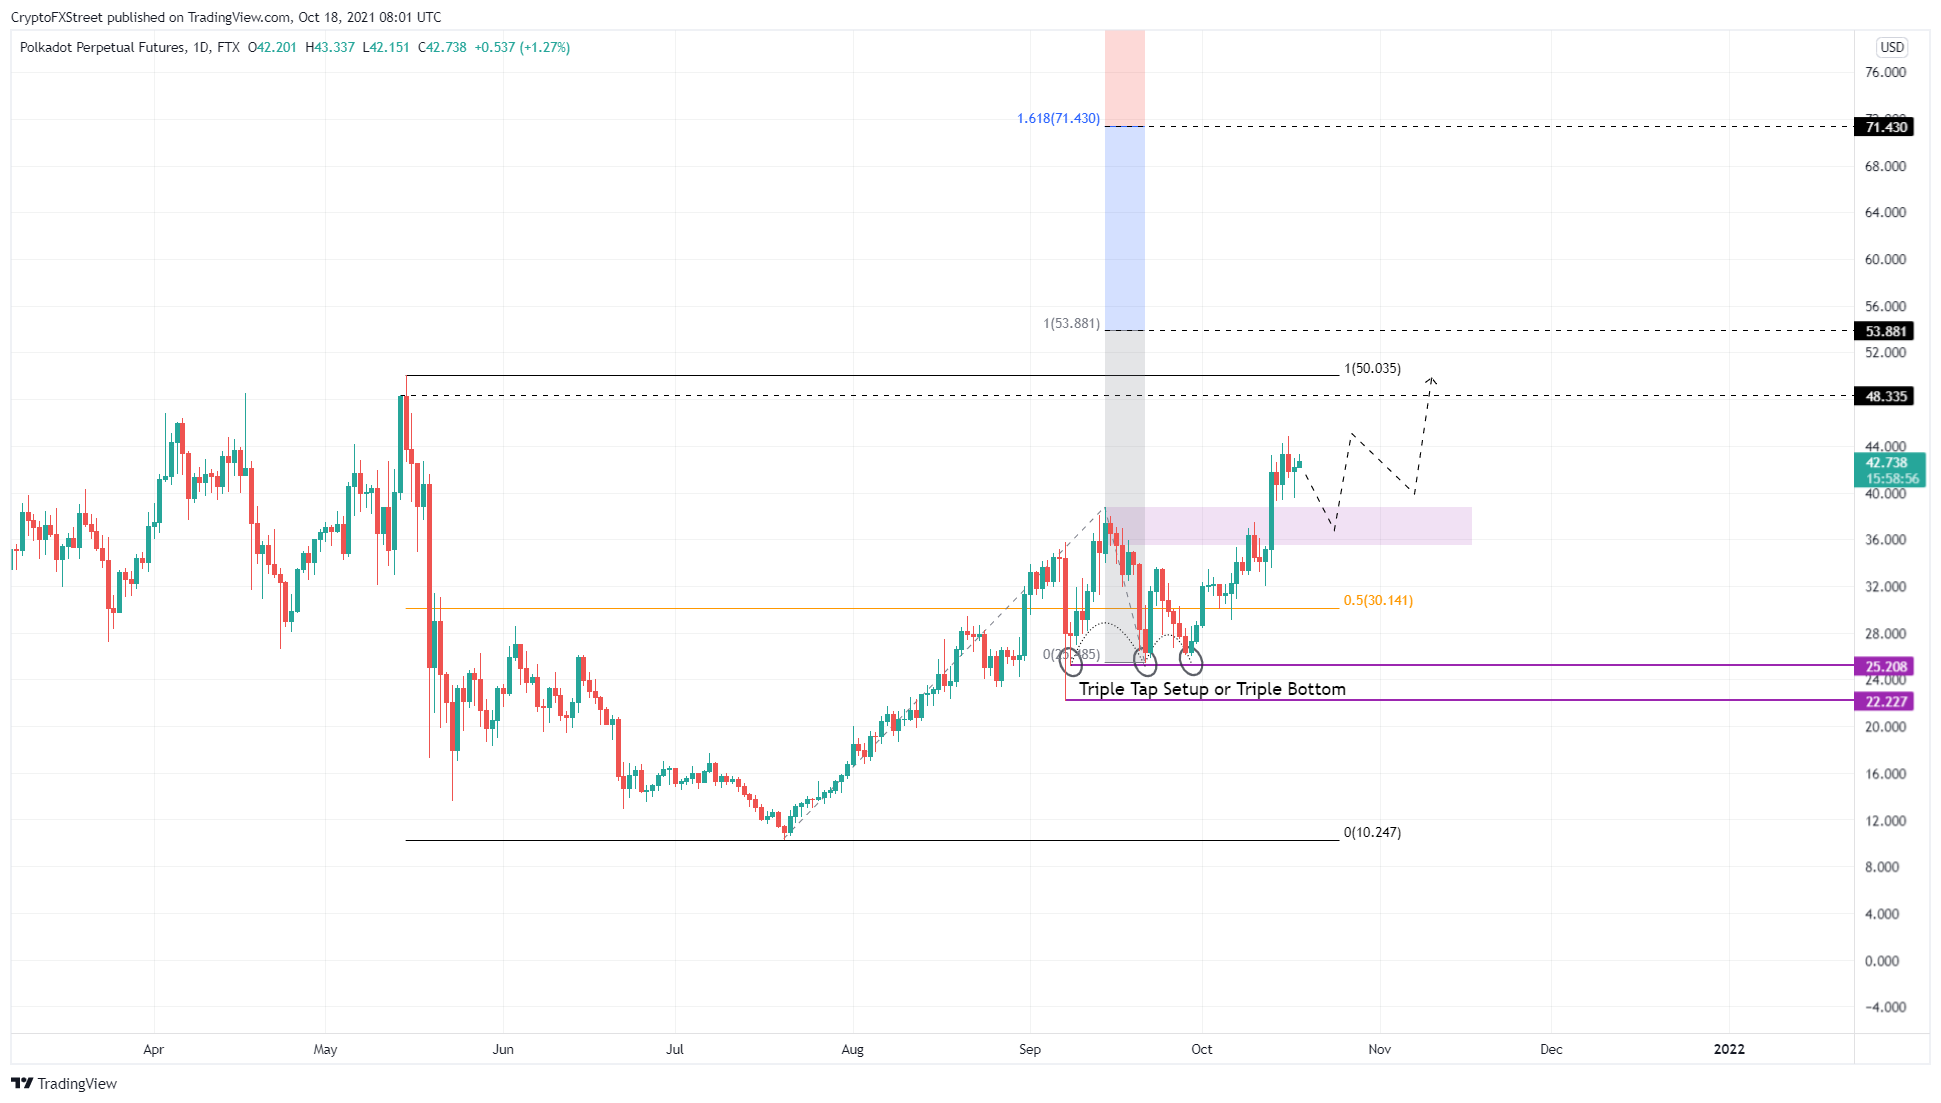
DOT/USDT 1-day chart
Regardless of the optimism around Polkadot price, a breakdown of the demand zone, extending from $35.48 to $38.76, will hurt the bullishness around DOT.
Such a move will likely knock Polkadot price down to the 50% Fibonacci retracement level at $30.14. If the sellers produce a decisive close below this barrier, it will invalidate the bullish thesis and trigger a correction to $25.21 or $22.23.
Information on these pages contains forward-looking statements that involve risks and uncertainties. Markets and instruments profiled on this page are for informational purposes only and should not in any way come across as a recommendation to buy or sell in these assets. You should do your own thorough research before making any investment decisions. FXStreet does not in any way guarantee that this information is free from mistakes, errors, or material misstatements. It also does not guarantee that this information is of a timely nature. Investing in Open Markets involves a great deal of risk, including the loss of all or a portion of your investment, as well as emotional distress. All risks, losses and costs associated with investing, including total loss of principal, are your responsibility. The views and opinions expressed in this article are those of the authors and do not necessarily reflect the official policy or position of FXStreet nor its advertisers. The author will not be held responsible for information that is found at the end of links posted on this page.
If not otherwise explicitly mentioned in the body of the article, at the time of writing, the author has no position in any stock mentioned in this article and no business relationship with any company mentioned. The author has not received compensation for writing this article, other than from FXStreet.
FXStreet and the author do not provide personalized recommendations. The author makes no representations as to the accuracy, completeness, or suitability of this information. FXStreet and the author will not be liable for any errors, omissions or any losses, injuries or damages arising from this information and its display or use. Errors and omissions excepted.
The author and FXStreet are not registered investment advisors and nothing in this article is intended to be investment advice.
Recommended Content
Editors’ Picks

Whale grabs 16,000 ETH as Ethereum Foundation vows support for L1, RWA and stablecoins
Ethereum Foundation's Co-Executive Director Tomasz K. Stańczak highlights simplified roadmap scaling blobs and improving L1 performance. Ethereum whale scoops 16,000 ETH, emphasizing growing interest in the token as the price recovers.

Bitcoin retests key resistance at $85K, breakout to $90K or rejection to $78K?
Bitcoin (BTC) price edges higher and approaches its key resistance at $85,000 on Monday, with a breakout indicating a bullish trend ahead. Metaplanet announced Monday that it purchased an additional 319 BTC, bringing its total holdings to 4,525 BTC.

XRP price teases breakout, bulls defend $2 support
Ripple (XRP) price grinds higher and trades at $2.15 during the early European session on Monday. The token sustained a bullish outlook throughout the weekend supported by bullish sentiment from the 90-day tariff suspension in the United States.

Senator Elizabeth Warren launches fresh offensive on crypto
Senators Elizabeth Warren, Mazie K. Hirono, and Dick Durbin want the DoJ’s decision to terminate crypto investigations reversed. The Senators raise concerns over the DoJ’s shift in priorities, terming it a “grave mistake.”

Bitcoin Weekly Forecast: Market uncertainty lingers, Trump’s 90-day tariff pause sparks modest recovery
Bitcoin (BTC) price extends recovery to around $82,500 on Friday after dumping to a new year-to-date low of $74,508 to start the week. Market uncertainty remains high, leading to a massive shakeout, with total liquidations hitting $2.18 billion across crypto markets.

The Best brokers to trade EUR/USD
SPONSORED Discover the top brokers for trading EUR/USD in 2025. Our list features brokers with competitive spreads, fast execution, and powerful platforms. Whether you're a beginner or an expert, find the right partner to navigate the dynamic Forex market.