- Polkadot price has been stuck under the $53.88 resistance level for five days.
- A decisive close above this barrier will propel DOT into the price discovery phase again.
- With the passing of referendum 42, parachains and crowdloans can start again.
Polkadot price saw a massive uptick in buying pressure on November 1, which pushed it into the price discovery mode for a brief period. However, this run-up was based on fumes, which has led to consolidation under a crucial resistance barrier. A breach of this level is likely to propel DOT to new highs.
Polkadot parachains and crowdloans to pave a new path
Polkadot Runtime has been upgraded to v9122 after the recent proposal on November 4. This implementation will allow the DOT developers to register on the parachains that will open the path to seek crowdloans.
Developers can seek loans via auction from DOT holders. However, the project warns users not to deposit their funds directly but go through a different channel.
Do not transfer any funds directly to a specific account that is associated with a loan or a team. Use the "Contribute" action to record the contribution on-chain using the crowdloan runtime module. When the fund is dissolved, after either the parachain lease expires or the loan ending without winning, the full value will be returned to your account by the runtime.
So far, 12 projects have already completed the crowdloan process, with nine yet to receive the funding.
Unlike Initial Dex Offering (IDO) or other methods, this development will pave the ways for projects and developers to raise capital by registering on the parachains. November 7 marks the fourth anniversary of the Polkadot codebase.
Polkadot price ready to set new highs
Polkadot price rose roughly 30% after it saw a massive surge in buying pressure on November 1. This uptick, however, failed to follow through, leading to consolidation under the 100% Fibonacci extension level at $53.88. Therefore, DOT needs to flip this hurdle into a support barrier to confirm the start of an upswing.
Doing so will allow Polkadot price to rally to the next barrier at $71.43 after a 30% climb from the current position. While this run-up is bullish, it will indicate that the bulls are back. In some cases, the ascent could extend, allowing DOT to tag the $100 psychological level, coinciding with the 261.8% Fibonacci extension level.
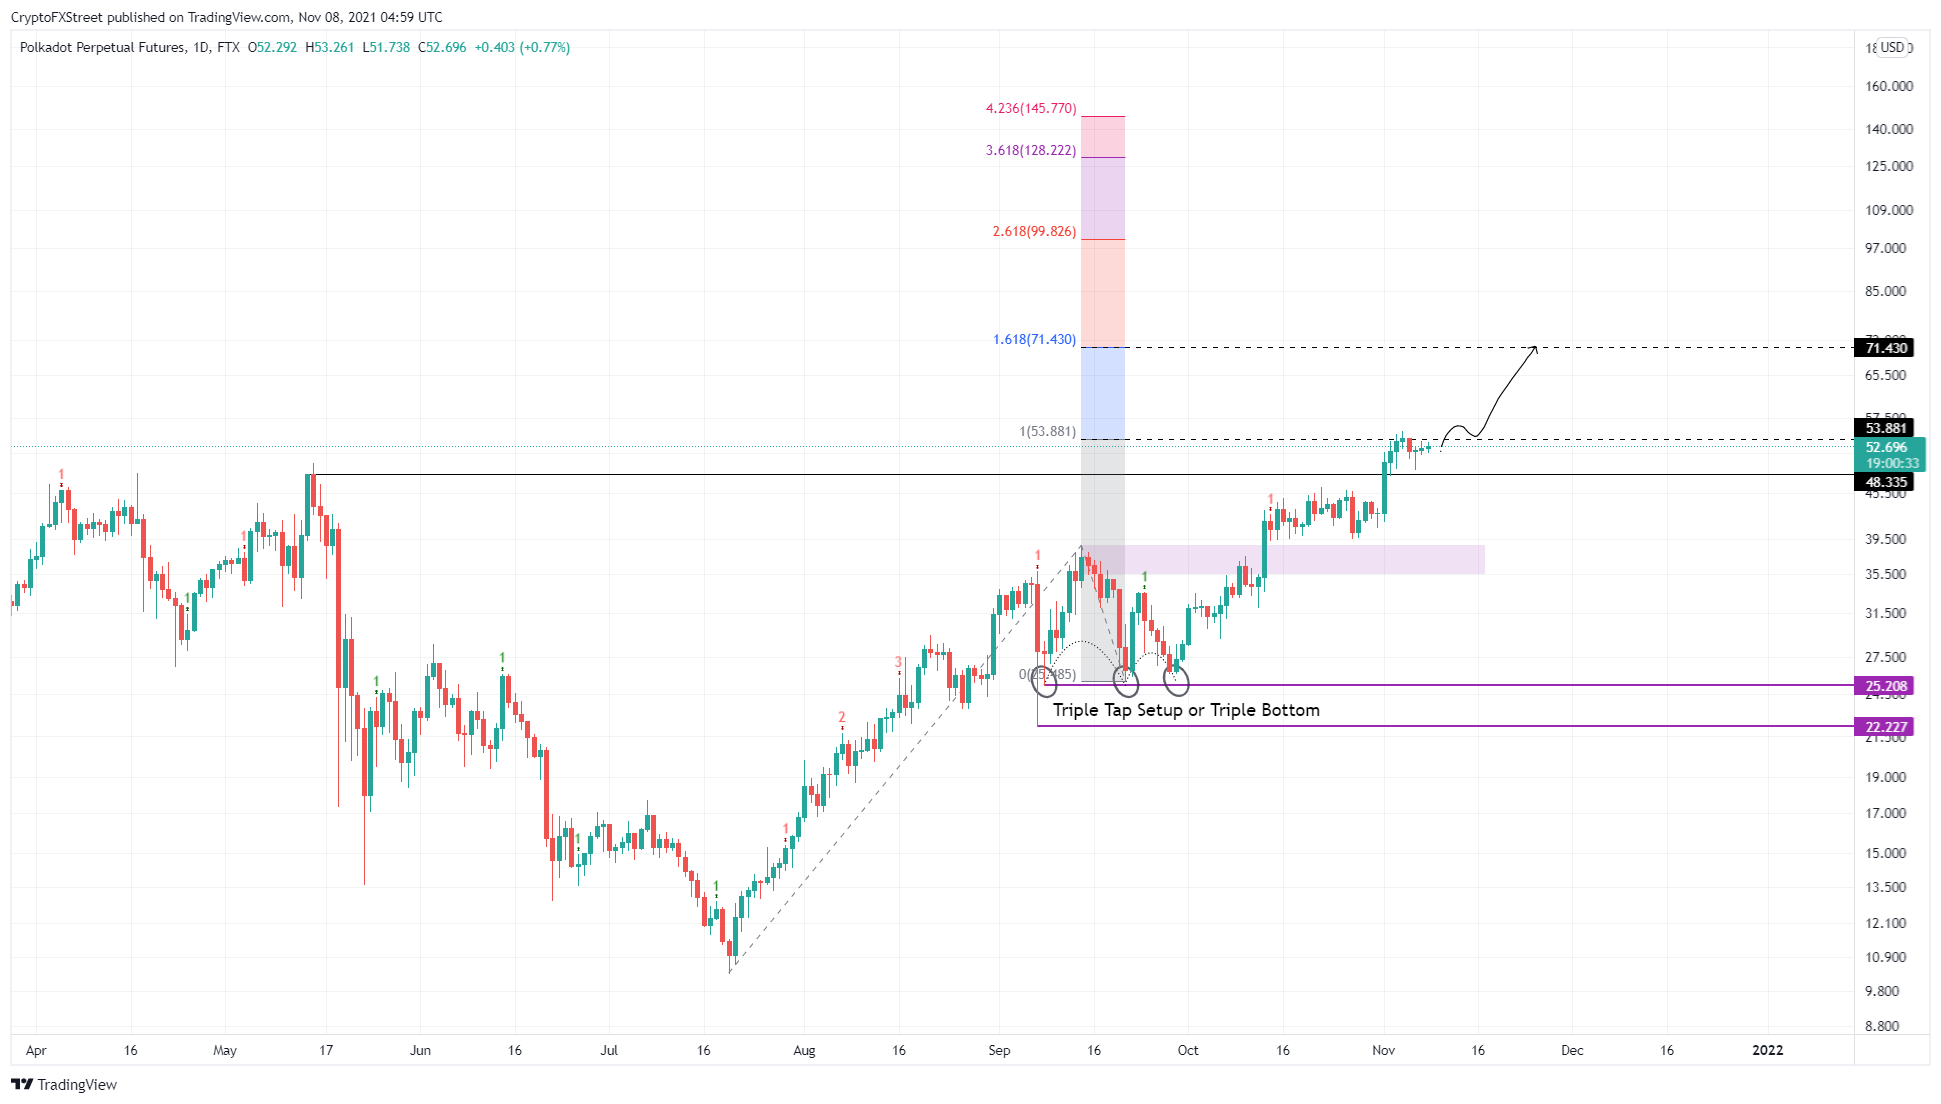
DOT/USDT 1-day chart
While things are looking up for Polkadot price, a breakdown of the $48.33 support floor will indicate that the selling pressure has risen considerably and could mean that investors are booking profits. A daily close below this barrier will invalidate the bullish thesis and potentially trigger a 19% downswing to the demand zone ranging from $35.48 to $38.76.
Information on these pages contains forward-looking statements that involve risks and uncertainties. Markets and instruments profiled on this page are for informational purposes only and should not in any way come across as a recommendation to buy or sell in these assets. You should do your own thorough research before making any investment decisions. FXStreet does not in any way guarantee that this information is free from mistakes, errors, or material misstatements. It also does not guarantee that this information is of a timely nature. Investing in Open Markets involves a great deal of risk, including the loss of all or a portion of your investment, as well as emotional distress. All risks, losses and costs associated with investing, including total loss of principal, are your responsibility. The views and opinions expressed in this article are those of the authors and do not necessarily reflect the official policy or position of FXStreet nor its advertisers. The author will not be held responsible for information that is found at the end of links posted on this page.
If not otherwise explicitly mentioned in the body of the article, at the time of writing, the author has no position in any stock mentioned in this article and no business relationship with any company mentioned. The author has not received compensation for writing this article, other than from FXStreet.
FXStreet and the author do not provide personalized recommendations. The author makes no representations as to the accuracy, completeness, or suitability of this information. FXStreet and the author will not be liable for any errors, omissions or any losses, injuries or damages arising from this information and its display or use. Errors and omissions excepted.
The author and FXStreet are not registered investment advisors and nothing in this article is intended to be investment advice.
Recommended Content
Editors’ Picks

Bitcoin holds $84,000 despite Fed’s hawkish remarks and spot ETFs outflows
Bitcoin is stabilizing around $84,000 at the time of writing on Thursday after facing multiple rejections around the 200-day EMA at $85,000 since Saturday. Despite risk-off sentiment due to the hawkish remarks by the US Fed on Wednesday, BTC remains relatively stable.

Crypto market cap fell more than 18% in Q1, wiping out $633.5 billion after Trump’s inauguration top
CoinGecko’s Q1 Crypto Industry Report highlights that the total crypto market capitalization fell by 18.6% in the first quarter, wiping out $633.5 billion after topping on January 18, just a couple of days ahead of US President Donald Trump’s inauguration.

Top meme coin gainers FARTCOIN, AIDOGE, and MEW as Trump coins litmus test US SEC ethics
Cryptocurrencies have been moving in lockstep since Monday, largely reflecting sentiment across global markets as United States (US) President Donald Trump's tariffs and trade wars take on new shapes and forms each passing day.

XRP buoyant above $2 as court grants Ripple breathing space in SEC lawsuit
A US appellate court temporarily paused the SEC-Ripple case for 60 days, holding the appeal in abeyance. The SEC is expected to file a status report by June 15, signaling a potential end to the four-year legal battle.
Bitcoin Weekly Forecast: Market uncertainty lingers, Trump’s 90-day tariff pause sparks modest recovery
Bitcoin (BTC) price extends recovery to around $82,500 on Friday after dumping to a new year-to-date low of $74,508 to start the week. Market uncertainty remains high, leading to a massive shakeout, with total liquidations hitting $2.18 billion across crypto markets.

The Best brokers to trade EUR/USD
SPONSORED Discover the top brokers for trading EUR/USD in 2025. Our list features brokers with competitive spreads, fast execution, and powerful platforms. Whether you're a beginner or an expert, find the right partner to navigate the dynamic Forex market.