- DOT price is beneath the descending parallel channel median line.
- Polkadot price is forming a bearish flag.
- Invalidation of the downtrend is a breach at $20.
Polkadot price still looks unappealing as the price is currently coiling into a bearish flag. Traders should look for potential short entries or stay away entirely.
Polkadot price is still bearish
Polkadot price has printed its lowest candlestick this month at $16.40. Since the DOT price has been coiling upwards into a smaller parallel channel that looks like a bearish flag, the DOT price can continue the countertrend for several more days, so being an early seller is not advised. Traders should consider setting alerts at the breach and close below the trend channel to ensure being on the right side of the trade.
Polkadot price has bearish targets at $15 and $14.50. The bulls have yet to display any significant change to consider a stronger countertrend rally. The safest invalidation for the bear's thesis is a breach of the parallel channel's origin point, which is at $20. Intraday traders can consider placing a stop above the smaller parallel channel if and when the channel is breached and closed to the downside.
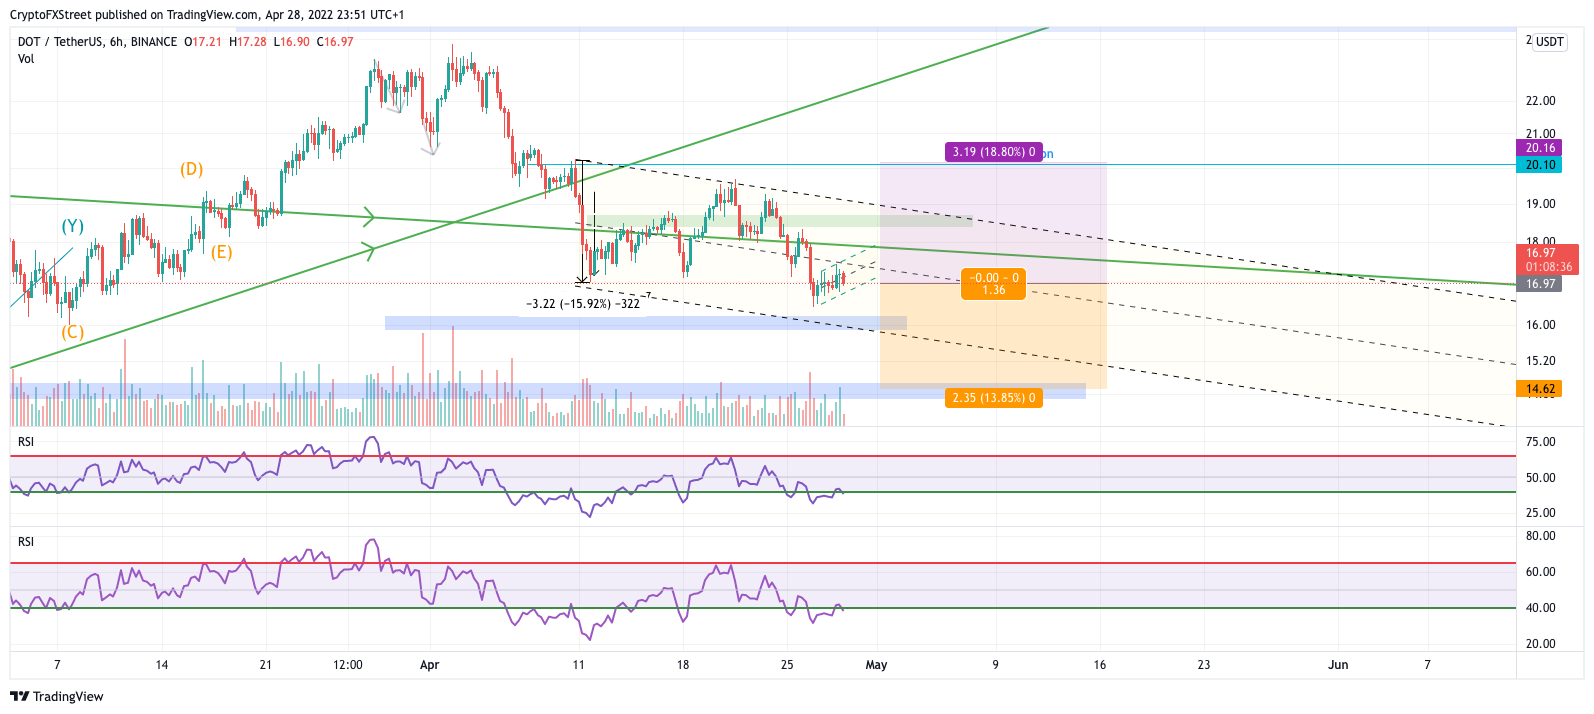
DOT/USDT 6-Hour Chart
The $20 invalidation level creates a 1.35 risk to reward ratio to the $14.50 target. If $14.50 gets breached, a pullback will eventually occur. After the pullback, analysts will look for an entry to join the bull run to target $24, resulting in a 20% increase from the current price.
Information on these pages contains forward-looking statements that involve risks and uncertainties. Markets and instruments profiled on this page are for informational purposes only and should not in any way come across as a recommendation to buy or sell in these assets. You should do your own thorough research before making any investment decisions. FXStreet does not in any way guarantee that this information is free from mistakes, errors, or material misstatements. It also does not guarantee that this information is of a timely nature. Investing in Open Markets involves a great deal of risk, including the loss of all or a portion of your investment, as well as emotional distress. All risks, losses and costs associated with investing, including total loss of principal, are your responsibility. The views and opinions expressed in this article are those of the authors and do not necessarily reflect the official policy or position of FXStreet nor its advertisers. The author will not be held responsible for information that is found at the end of links posted on this page.
If not otherwise explicitly mentioned in the body of the article, at the time of writing, the author has no position in any stock mentioned in this article and no business relationship with any company mentioned. The author has not received compensation for writing this article, other than from FXStreet.
FXStreet and the author do not provide personalized recommendations. The author makes no representations as to the accuracy, completeness, or suitability of this information. FXStreet and the author will not be liable for any errors, omissions or any losses, injuries or damages arising from this information and its display or use. Errors and omissions excepted.
The author and FXStreet are not registered investment advisors and nothing in this article is intended to be investment advice.
Recommended Content
Editors’ Picks

SEC Crypto Task Force plans to establish digital asset regulatory sandbox
The Securities & Exchange Commission's (SEC) Crypto Task Force met with El Salvador's National Commission on Digital Assets (CNAD) representatives to discuss cross-border regulation and a proposed cross-border sandbox project.

DeFi Dev Corp buys additional 65,305 SOL amid broader institutional interest: Solana price slides below $150
Solana (SOL) price faces growing overhead pressure and slides below $150 to trade at $148 at the time of writing on Thursday. The sudden pullback follows the crypto market's edging higher on improving investor sentiment, which saw SOL climb to $154 on Wednesday.

Uniswap Price Forecast: UNI whale moves 9 million tokens to Coinbase Prime
Uniswap (UNI) price hovers around $5.92 at the time of writing on Thursday, having rallied 12.8% so far this week. According to Wu Blockchain, data shows that the address potentially related to the Uniswap team, investor, or advisor transferred 9 million UNI to the Coinbase Prime Deposit on Thursday.

Tron DAO announces $70B USDT supply: Here's how TRX price could react
TRON’s USDT circulation just surpassed $70 billion, signaling rising network utility as TRX price approaches a technically significant breakout. On Wednesday, TRON DAO confirmed that the circulating supply of Tether (USDT) on its blockchain has surpassed $70 billion.

Bitcoin Weekly Forecast: BTC holds steady, Fed warns of tariffs’ impact, as Gold hits new highs
Bitcoin price consolidates above $84,000 on Friday, a short-term support that has gained significance this week. The world's largest cryptocurrency by market capitalization continued to weather storms caused by US President Donald Trump's incessant trade war with China after pausing reciprocal tariffs for 90 days on April 9 for other countries.

The Best brokers to trade EUR/USD
SPONSORED Discover the top brokers for trading EUR/USD in 2025. Our list features brokers with competitive spreads, fast execution, and powerful platforms. Whether you're a beginner or an expert, find the right partner to navigate the dynamic Forex market.