- Polkadot price has set up a slew of higher highs and higher lows, suggesting a bullish outlook.
- Investors can expect DOT to rally 15% and retest the weekly supply zone, extending from $22.37 to $28.47.
- A breakdown of the $16.89 support level will invalidate the optimistic thesis.
Polkadot price is on a leg-up that could extend higher and retest a resistance barrier confluence. Investors have the opportunity to position themselves in the right direction and capitalize on this short-term up move.
Polkadot price to embark on a small journey
Polkadot price has set up three higher lows and three higher highs since January 24, signaling that an uptrend is underway. The recent swing low is a critical signal that could trigger Polkadot price to climb and retest the $22 hurdle.
Interestingly the weekly supply zone, ranging from $22.37 to $28.47, coincides with this hurdle, increasing its resistance potential and making it a tough nut to crack. Investors can, therefore, expect the DOT rally to cease around this ceiling.
Bullish market participants can still open a long position from the current position at $19.15 and book profits around $22. Or in the case where buying pressure continues, the Polkadot price might pierce the supply zone and retest the weekly barrier at $24.18, coinciding with the 50-day Simple Moving Average (SMA), and bringing the total gain to 26%.
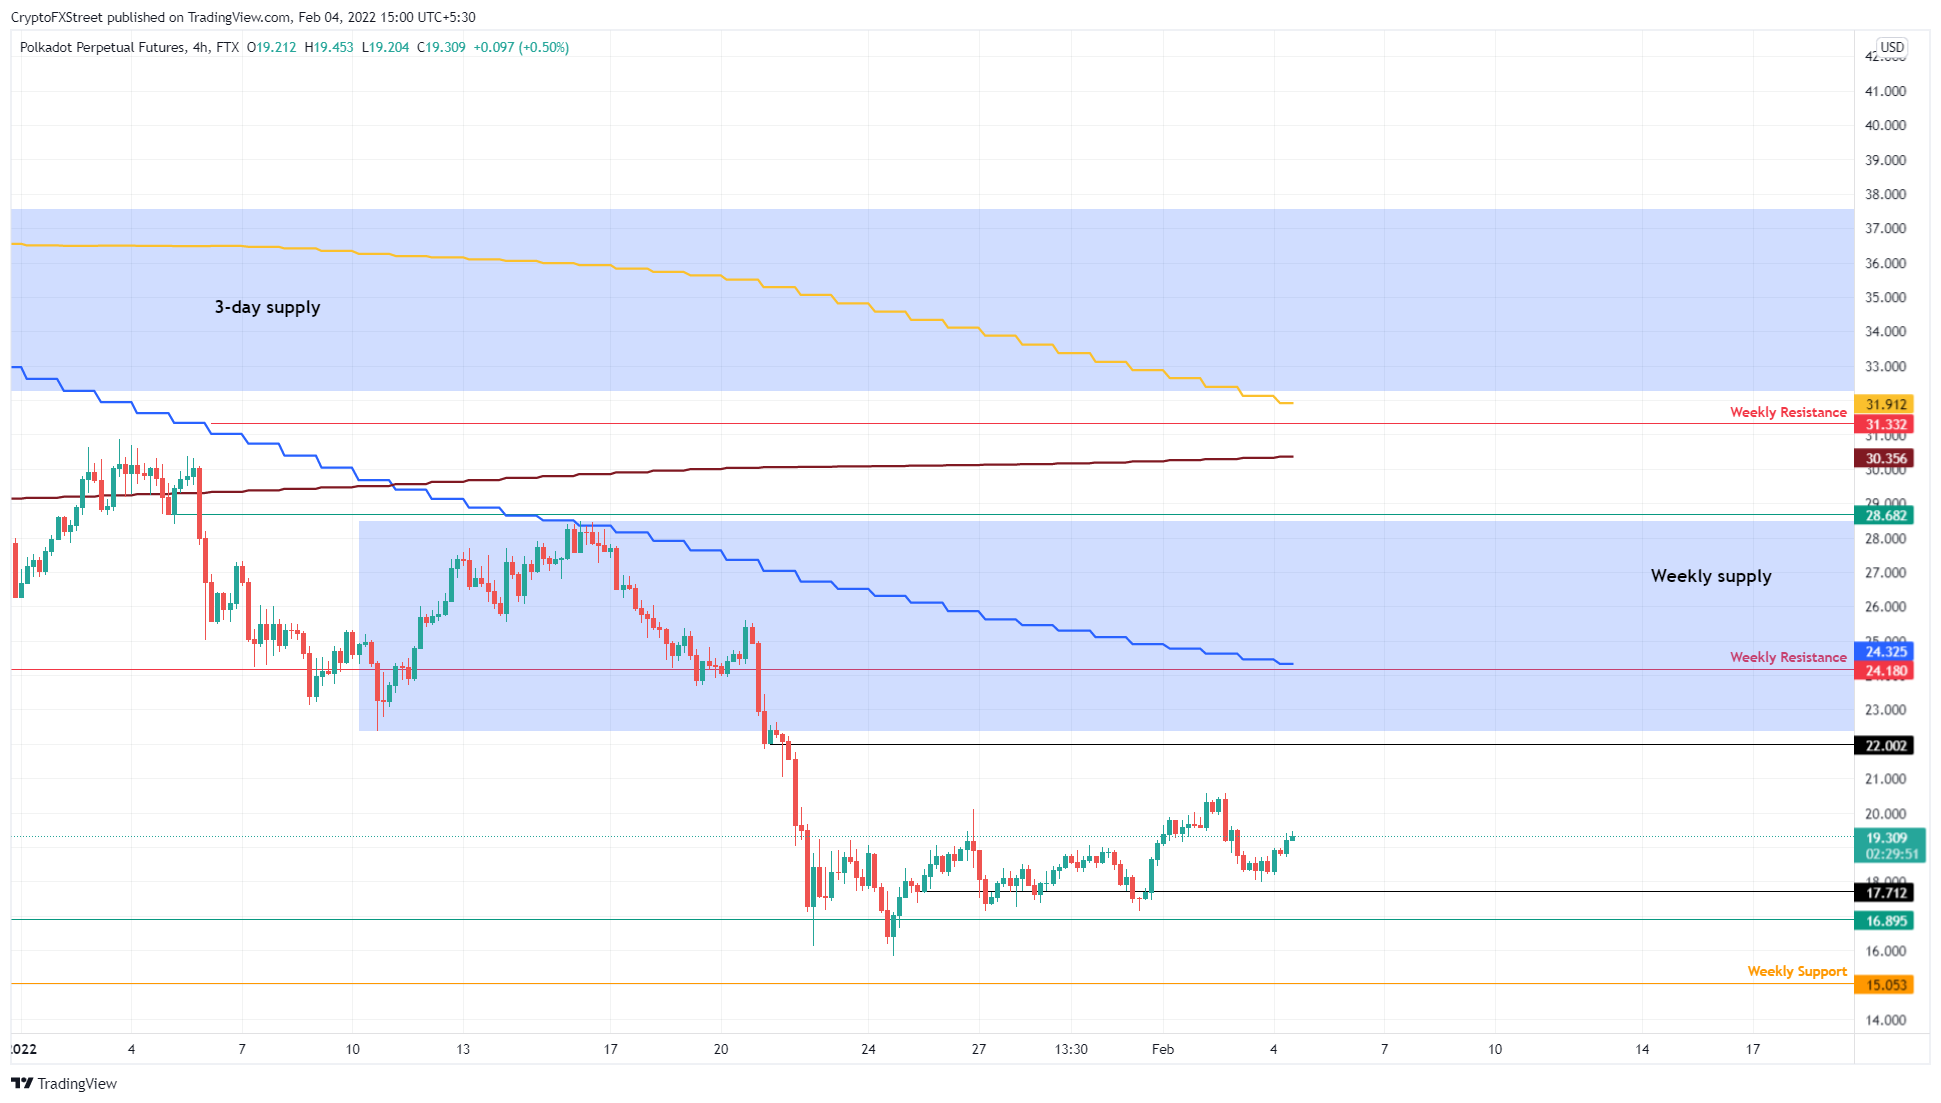
DOT/USDT 4-hour chart
Alternatively, if the Polkadot price produces a four-hour candlestick close below the $16.89 support level, it will create a lower low, and this development will invalidate the bullish thesis, decreasing confidence among sidelined buyers.
In such a situation, sellers may easily take control and knock the Polkadot price down to tag the weekly support level at $15.05. Here, buyers can band together, however, and give the uptrend another go.
Information on these pages contains forward-looking statements that involve risks and uncertainties. Markets and instruments profiled on this page are for informational purposes only and should not in any way come across as a recommendation to buy or sell in these assets. You should do your own thorough research before making any investment decisions. FXStreet does not in any way guarantee that this information is free from mistakes, errors, or material misstatements. It also does not guarantee that this information is of a timely nature. Investing in Open Markets involves a great deal of risk, including the loss of all or a portion of your investment, as well as emotional distress. All risks, losses and costs associated with investing, including total loss of principal, are your responsibility. The views and opinions expressed in this article are those of the authors and do not necessarily reflect the official policy or position of FXStreet nor its advertisers. The author will not be held responsible for information that is found at the end of links posted on this page.
If not otherwise explicitly mentioned in the body of the article, at the time of writing, the author has no position in any stock mentioned in this article and no business relationship with any company mentioned. The author has not received compensation for writing this article, other than from FXStreet.
FXStreet and the author do not provide personalized recommendations. The author makes no representations as to the accuracy, completeness, or suitability of this information. FXStreet and the author will not be liable for any errors, omissions or any losses, injuries or damages arising from this information and its display or use. Errors and omissions excepted.
The author and FXStreet are not registered investment advisors and nothing in this article is intended to be investment advice.
Recommended Content
Editors’ Picks

Tether expands reach with Juventus acquisition and new Bitcoin-native public company launch
Tether announced on Thursday that it had acquired additional shares in Juventus Football Club, bringing its total stake to over 10.12% and representing 6.18% of voting rights. Tether, Bitfinex, SoftBank & Jack Mallers also launch Twenty-One, the first Bitcoin-native public company.

Ethereum Price Forecast: Accumulation addresses grab 1.11 million ETH as bullish momentum rises
Ethereum (ETH) saw a 1% decline on Friday as sellers dominated exchange activity in the past 24 hours. Despite the recent selling, increased inflows into accumulation addresses and declining net taker volume show a gradual return of bullish momentum.

Stacks price eyes $1 amid growing interest in Bitcoin layer-2 protocols' DeFi ecosystems
Stacks (STX) price rises, hitting a new weekly high at $0.90 during the Asian session on Friday. The Bitcoin layer-2 protocol shows bullish resilience, trading at $0.88 at the time of writing, reflecting growing institutional interest in the decentralized finance (DeFi) ecosystem.

Bitcoin's surge to $94,000 shows a mix of macro optimism and shifting investor sentiment: Glassnode
Bitcoin (BTC) traded above $93,000 on Thursday as rumors of US-China tariff easing stirred a rebound in price, sending the percentage of supply in profit at current price levels to 87.3%, 5% above 82.7% recorded in March, according to Glassnode data.
Bitcoin Weekly Forecast: BTC holds steady, Fed warns of tariffs’ impact, as Gold hits new highs
Bitcoin price consolidates above $84,000 on Friday, a short-term support that has gained significance this week. The world's largest cryptocurrency by market capitalization continued to weather storms caused by US President Donald Trump's incessant trade war with China after pausing reciprocal tariffs for 90 days on April 9 for other countries.

The Best brokers to trade EUR/USD
SPONSORED Discover the top brokers for trading EUR/USD in 2025. Our list features brokers with competitive spreads, fast execution, and powerful platforms. Whether you're a beginner or an expert, find the right partner to navigate the dynamic Forex market.