- Polkadot price has severed its downtrend by triggering a breakout above the declining trend line.
- A bullish divergence suggests a further upswing that could push DOT to retest the immediate resistance level at $6.85.
- A daily candlestick close below $6.00 could prevent a bullish scenario from taking place.
Polkadot price seems to be cooking up a bullish move from a technical perspective, but the general market conditions are not ripe. Therefore, investors need to be careful in making their moves based on technicals alone.
Polkadot price gears up
Polkadot price has produced three lower highs since August 10, shedding roughly 36%. As DOT trades at $6.25, the technicals seem to be improving quite a bit.
The first sign is the breakout above the declining trend line connecting these lower highs formed since August 10. Furthermore, Polkadot price seems to have also produced a higher low relative to the September 21 swing low at $6.12.
In this same period, the Relative Strength Index (RSI) has set up higher lows, indicating a divergence between the price and the indicator. Since the momentum is rising, this formation is termed as ‘bullish divergence.’
The said pattern results in a bullish move for the underlying asset. Therefore, the technicals for Polkadot price hint at an incoming rally. The immediate resistance level at $6.85 is the best candidate, but investors need to be cautious as a selloff in Bitcoin price could delay this move from DOT.
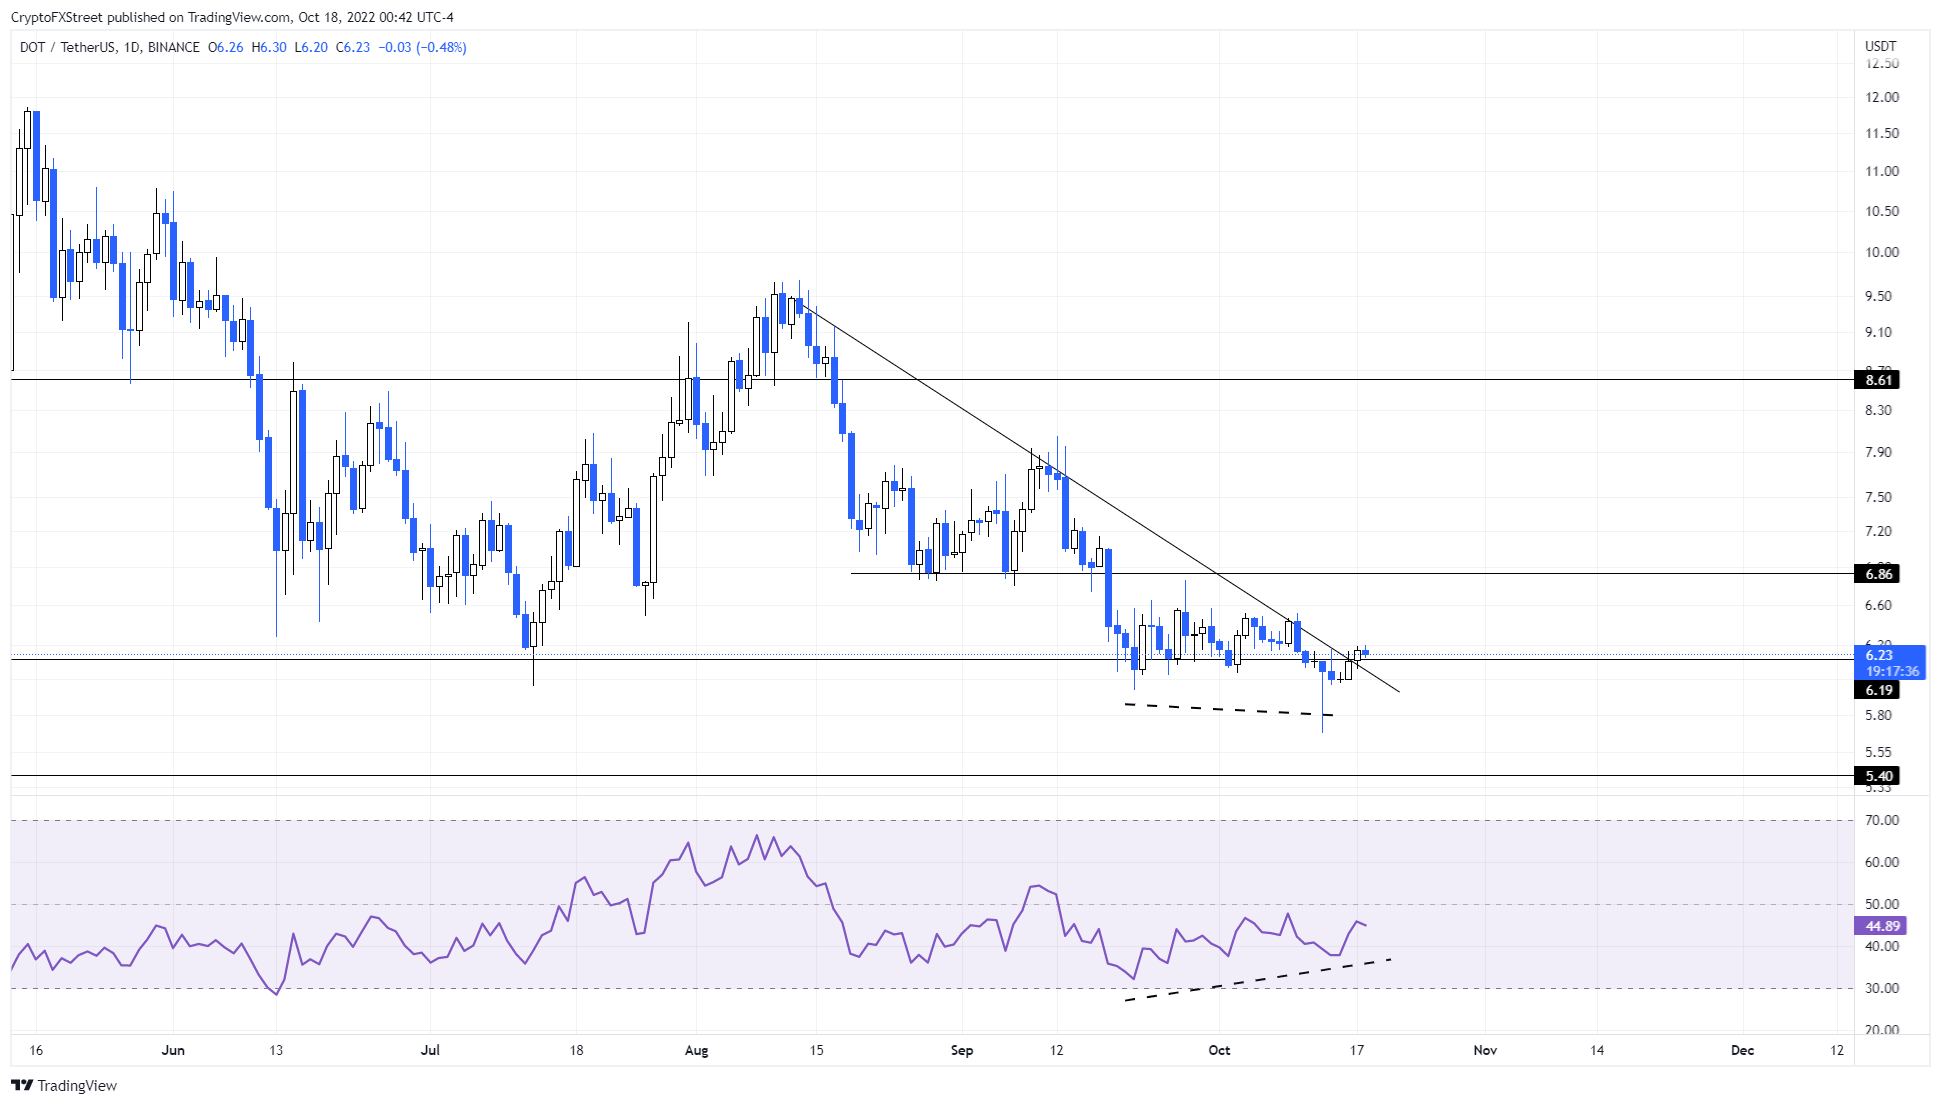
DOT/USDT 1-day chart
While things are looking up for Polkadot price, a breakdown of the $6.00 psychological level will indicate the shift in narrative favoring the bears. In such a case, market participants can expect DOT to retest the $5.40 support level.
Note:
The video attached below talks about Bitcoin price and its potential outlook, however, this is still relevant as it is likely to influence Polkadot price.
Information on these pages contains forward-looking statements that involve risks and uncertainties. Markets and instruments profiled on this page are for informational purposes only and should not in any way come across as a recommendation to buy or sell in these assets. You should do your own thorough research before making any investment decisions. FXStreet does not in any way guarantee that this information is free from mistakes, errors, or material misstatements. It also does not guarantee that this information is of a timely nature. Investing in Open Markets involves a great deal of risk, including the loss of all or a portion of your investment, as well as emotional distress. All risks, losses and costs associated with investing, including total loss of principal, are your responsibility. The views and opinions expressed in this article are those of the authors and do not necessarily reflect the official policy or position of FXStreet nor its advertisers. The author will not be held responsible for information that is found at the end of links posted on this page.
If not otherwise explicitly mentioned in the body of the article, at the time of writing, the author has no position in any stock mentioned in this article and no business relationship with any company mentioned. The author has not received compensation for writing this article, other than from FXStreet.
FXStreet and the author do not provide personalized recommendations. The author makes no representations as to the accuracy, completeness, or suitability of this information. FXStreet and the author will not be liable for any errors, omissions or any losses, injuries or damages arising from this information and its display or use. Errors and omissions excepted.
The author and FXStreet are not registered investment advisors and nothing in this article is intended to be investment advice.
Recommended Content
Editors’ Picks

IRS says crypto staking should be taxed in response to lawsuit
The IRS stated that rewards from cryptocurrency staking are taxable upon receipt, according to a Bloomberg report on Monday, which stated the agency rejected a legal argument that sought to delay taxation until such rewards are sold or exchanged.

Solana dominates Bitcoin, Ethereum in price performance and trading volume: Glassnode
Solana is up 6% on Monday following a Glassnode report indicating that SOL has seen more capital increase than Bitcoin and Ethereum. Despite the large gains suggesting a relatively heated market, SOL could still stretch its growth before establishing a top for the cycle.

Ethereum Price Forecast: ETH risks a decline to $3,000 as investors realize increased profits and losses
Ethereum is up 4% on Monday despite increased selling pressure across long-term and short-term holders in the past two days. If whales fail to maintain their recent buy-the-dip attitude, ETH risks a decline below $3,000.

Crypto Today: BTC hits new Trump-era low as Chainlink, HBAR and AAVE lead market recovery
The global cryptocurrency market cap shrank by $500 billion after the Federal Reserve's hawkish statements on December 17. Amid the market crash, Bitcoin price declined 7.2% last week, recording its first weekly timeframe loss since Donald Trump’s re-election.

Bitcoin: 2025 outlook brightens on expectations of US pro-crypto policy
Bitcoin price has surged more than 140% in 2024, reaching the $100K milestone in early December. The rally was driven by the launch of Bitcoin Spot ETFs in January and the reduced supply following the fourth halving event in April.

Best Forex Brokers with Low Spreads
VERIFIED Low spreads are crucial for reducing trading costs. Explore top Forex brokers offering competitive spreads and high leverage. Compare options for EUR/USD, GBP/USD, USD/JPY, and Gold.