- Polkadot holds firmly to the uptrend after ignoring the formation of a double-top pattern.
- A daily close above the ascending channel middle boundary could boost DOT uptrend further up.
Polkadot has grown consistently in the last couple of weeks to the extent of closing above $5 for a few days. On the upside, the price movement has been capped under $6. For now, all the attention is being channelled to breaking above the ascending parallel channel middle boundary layer to sustain the uptrend.
Polkadot uphill battle to break critical barrier
As mentioned, the rally in the last two weeks has been consistent within an ascending parallel channel's confines. The multiple rejections at the channel upper boundary have delayed the breakout that continues to eye $6.5.
Meanwhile, Polkadot is trading at $5.6 while fighting to break the channel's middle boundary resistance. If DOT closed above this crucial level, the uptrend might sustain, bringing into the light a bullish outlook. Similarly, a spike above the channel might result in massive gains, even overshooting the short-term target at $6.5.
The Relative Strength Index has confirmed the likelihood of the uptrend, sailing through after bouncing off support at the midline. At the time of writing, the RSI moves towards the overbought territory, thus suggesting that the bullish grip is getting stronger.
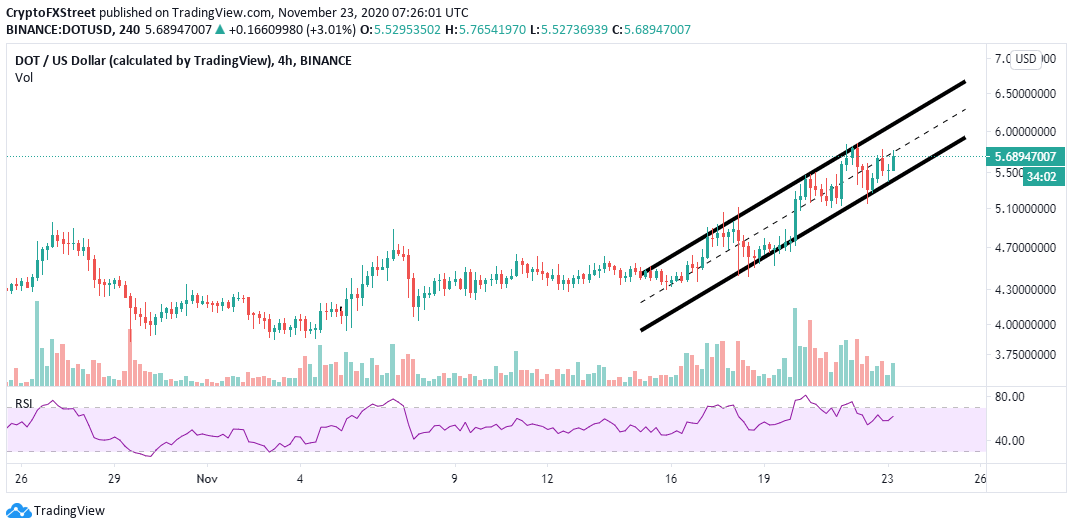
DOT/USD 4-hour chart
The 12-hour chart highlights the formation of a double-top pattern that is likely to be ignored, thus validating the uptrend. Note that double-tops are bearish chart patterns that indicate that a correction is nigh. They are formed when the price of an asset hits the same peak twice.
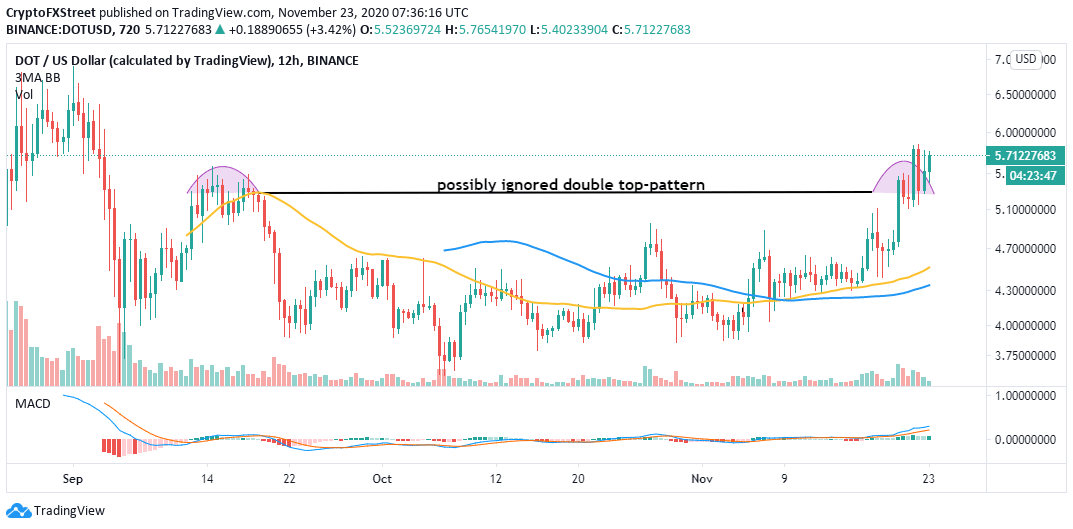
DOT/USD 12-hour chart
Polkadot's rally delay occurred on hitting the second top, but the uptrend seems to be resuming. Therefore, the price could spike higher. Besides, the Moving Average Convergence Divergence (MACD) shows that the odds favor the bulls, at least for now.
The TD Sequential indicator is likely to flash a sell signal on the daily chart in the coming sessions. The call will take the form of a green nine candlestick and may lead to a correction in one to four daily candlesticks.
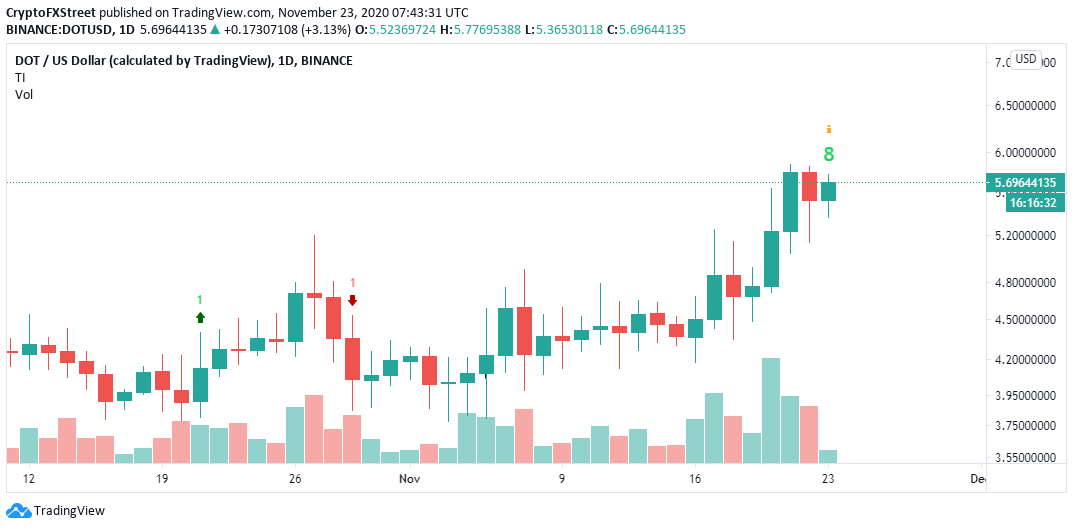
DOT/USD daily chart
On the other hand, if DOT/USD fails to close above the channel's middle boundary, a reversal may also come into the picture. Selling orders are likely to increase, forcing Polkadot to seek refuge in the range between the 100 Simple Moving Average on the 4-hour chart at $5 and the 200 SMA at $4.5.
Information on these pages contains forward-looking statements that involve risks and uncertainties. Markets and instruments profiled on this page are for informational purposes only and should not in any way come across as a recommendation to buy or sell in these assets. You should do your own thorough research before making any investment decisions. FXStreet does not in any way guarantee that this information is free from mistakes, errors, or material misstatements. It also does not guarantee that this information is of a timely nature. Investing in Open Markets involves a great deal of risk, including the loss of all or a portion of your investment, as well as emotional distress. All risks, losses and costs associated with investing, including total loss of principal, are your responsibility. The views and opinions expressed in this article are those of the authors and do not necessarily reflect the official policy or position of FXStreet nor its advertisers. The author will not be held responsible for information that is found at the end of links posted on this page.
If not otherwise explicitly mentioned in the body of the article, at the time of writing, the author has no position in any stock mentioned in this article and no business relationship with any company mentioned. The author has not received compensation for writing this article, other than from FXStreet.
FXStreet and the author do not provide personalized recommendations. The author makes no representations as to the accuracy, completeness, or suitability of this information. FXStreet and the author will not be liable for any errors, omissions or any losses, injuries or damages arising from this information and its display or use. Errors and omissions excepted.
The author and FXStreet are not registered investment advisors and nothing in this article is intended to be investment advice.
Recommended Content
Editors’ Picks

Bitcoin Weekly Forecast: BTC nosedives below $95,000 as spot ETFs record highest daily outflow since launch
Bitcoin price continues to edge down, trading below $95,000 on Friday after declining more than 9% this week. Bitcoin US spot ETFs recorded the highest single-day outflow on Thursday since their launch in January.

Bitcoin crashes to $96,000, altcoins bleed: Top trades for sidelined buyers
Bitcoin (BTC) slipped under the $100,000 milestone and touched the $96,000 level briefly on Friday, a sharp decline that has also hit hard prices of other altcoins and particularly meme coins.

Solana Price Forecast: SOL’s technical outlook and on-chain metrics hint at a double-digit correction
Solana (SOL) price trades in red below $194 on Friday after declining more than 13% this week. The recent downturn has led to $38 million in total liquidations, with over $33 million coming from long positions.

SEC approves Hashdex and Franklin Templeton's combined Bitcoin and Ethereum crypto index ETFs
The SEC approved Hashdex's proposal for a crypto index ETF. The ETF currently features Bitcoin and Ethereum, with possible additions in the future. The agency also approved Franklin Templeton's amendment to its Cboe BZX for a crypto index ETF.

Bitcoin: 2025 outlook brightens on expectations of US pro-crypto policy
Bitcoin (BTC) price has surged more than 140% in 2024, reaching the $100K milestone in early December. The rally was driven by the launch of Bitcoin Spot Exchange Traded Funds (ETFs) in January and the reduced supply following the fourth halving event in April.

Best Forex Brokers with Low Spreads
VERIFIED Low spreads are crucial for reducing trading costs. Explore top Forex brokers offering competitive spreads and high leverage. Compare options for EUR/USD, GBP/USD, USD/JPY, and Gold.