![]() Lorenzo Stroe
Lorenzo Stroe
Independent Analyst
- DOT is currently trading at $3.94 after a steep 43% correction from its all-time high.
- Polkadot was able to reach $5 billion in market capitalization within weeks of getting listed on exchanges.
Polkadot has been one of the most successful cryptocurrency projects, quickly climbing the market capitalization ranks positioning itself at number 7.
Polkadot is facing significant selling pressure
One of the most important patterns formed against DOT bulls is the descending triangle pattern on the daily chart.
DOT/USDT daily chart
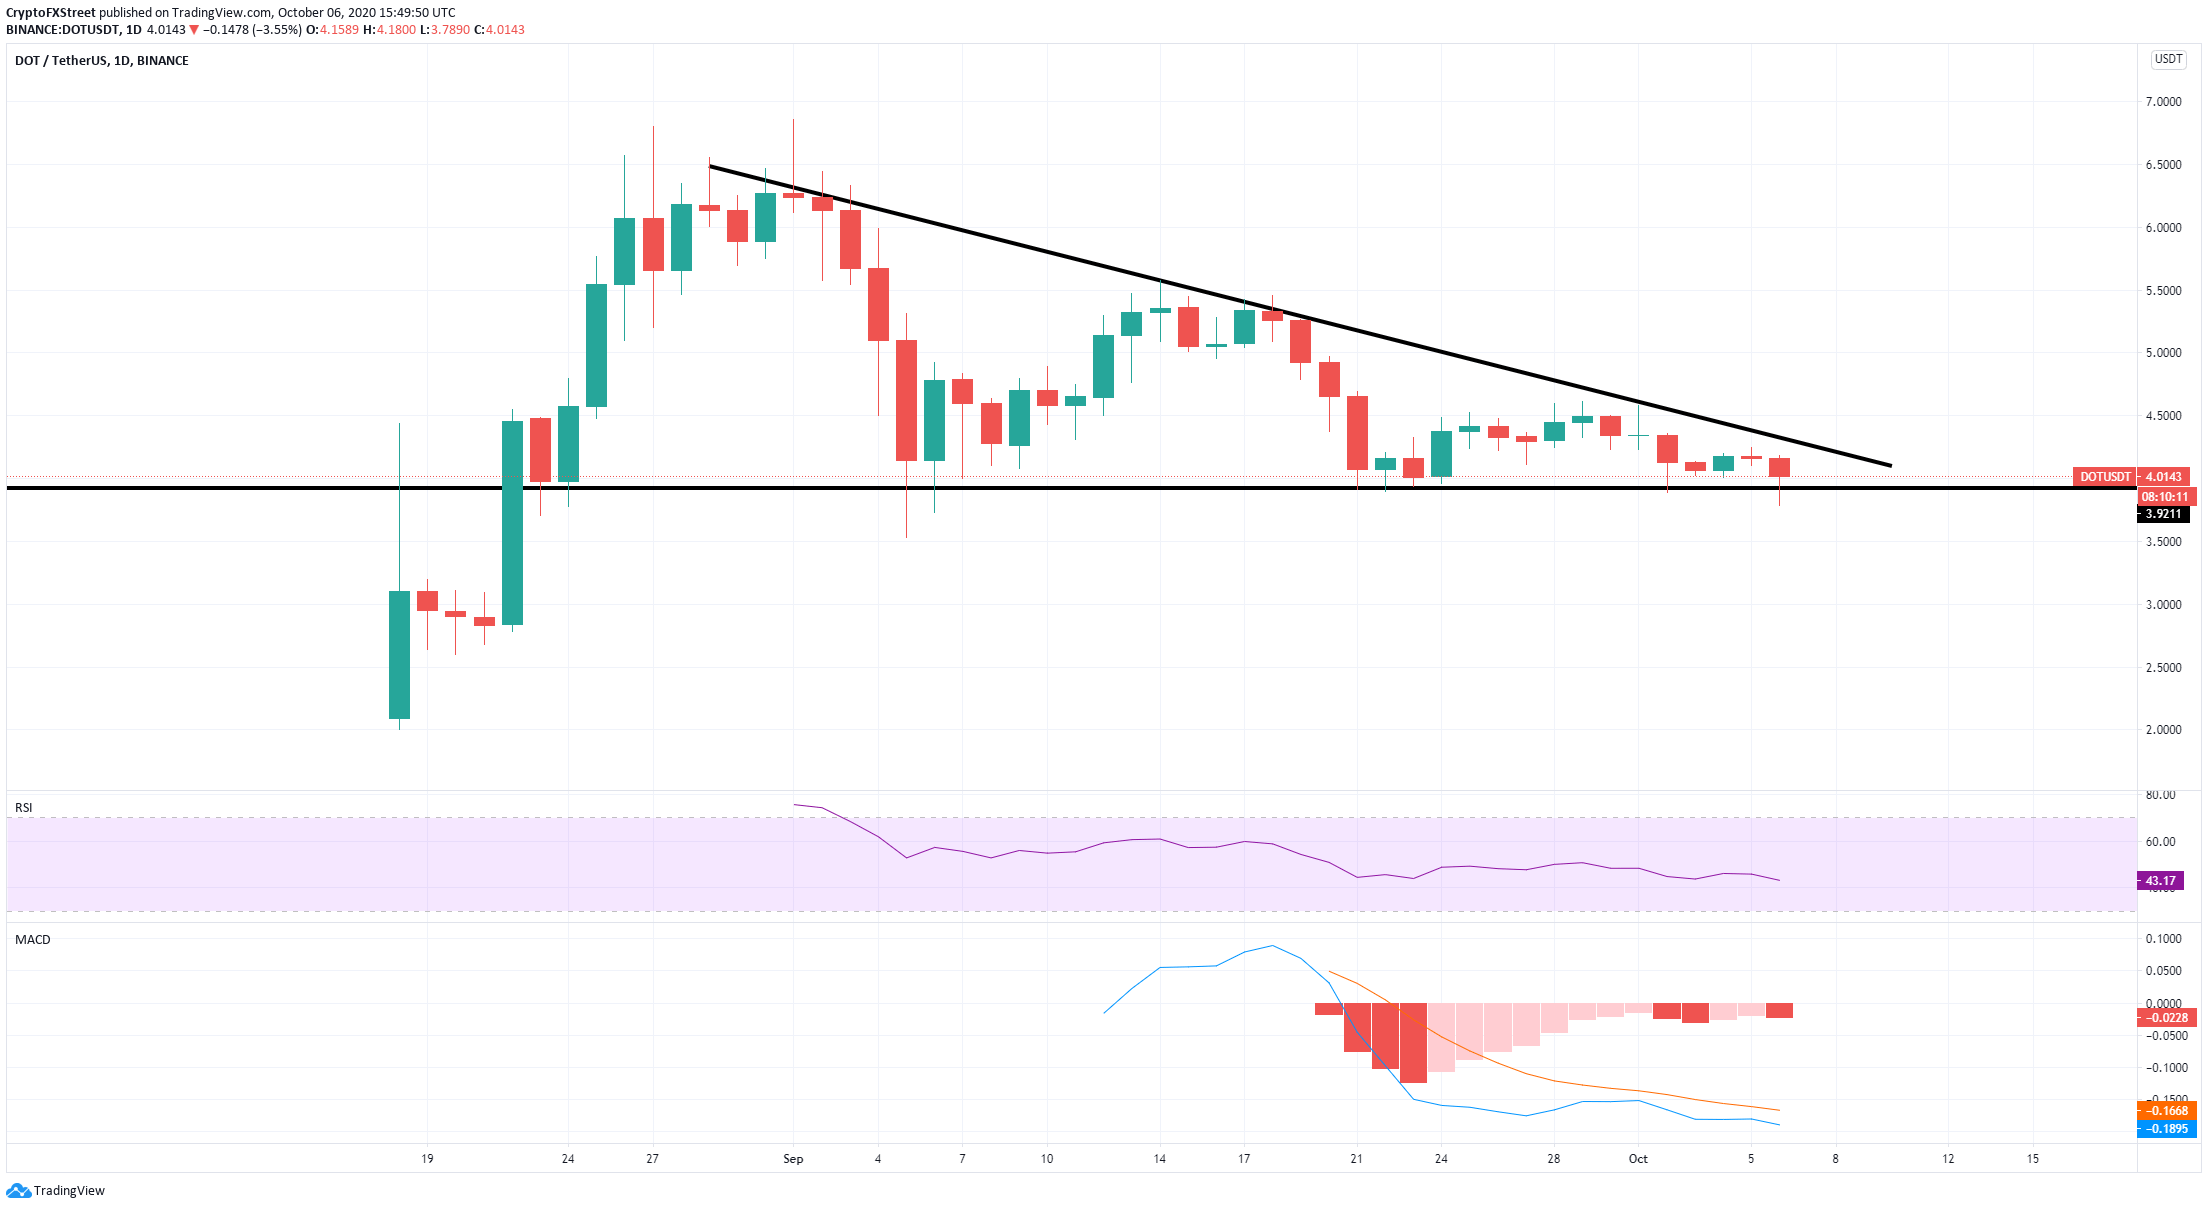
His bearish pattern has a horizontal trendline that connects a series of lows, representing the most significant support level. The current price of DOT is just above the support trendline at $3.9. A bearish breakout would be devastating for the digital asset's price and could lead to a 50% decline.
$DOT
— TraderXO (@Trader_XO) October 6, 2020
Ball height vs. time for first few bounces (assuming no aerodynamic drag). pic.twitter.com/h96XdhYVP7
Full-time trader, ‘Trader_XO’ tweeted a chart showing the magnitude of DOT's bounces from the support level at $3.9. We can observe that the first bounce was the strongest, followed by subsequent bounces that are far weaker, about half or even lower than the previous ones. The last bounce happened a few days ago and seemed to indicate that the next try could be a bearish breakout.
DOT/USD 4-hour chart
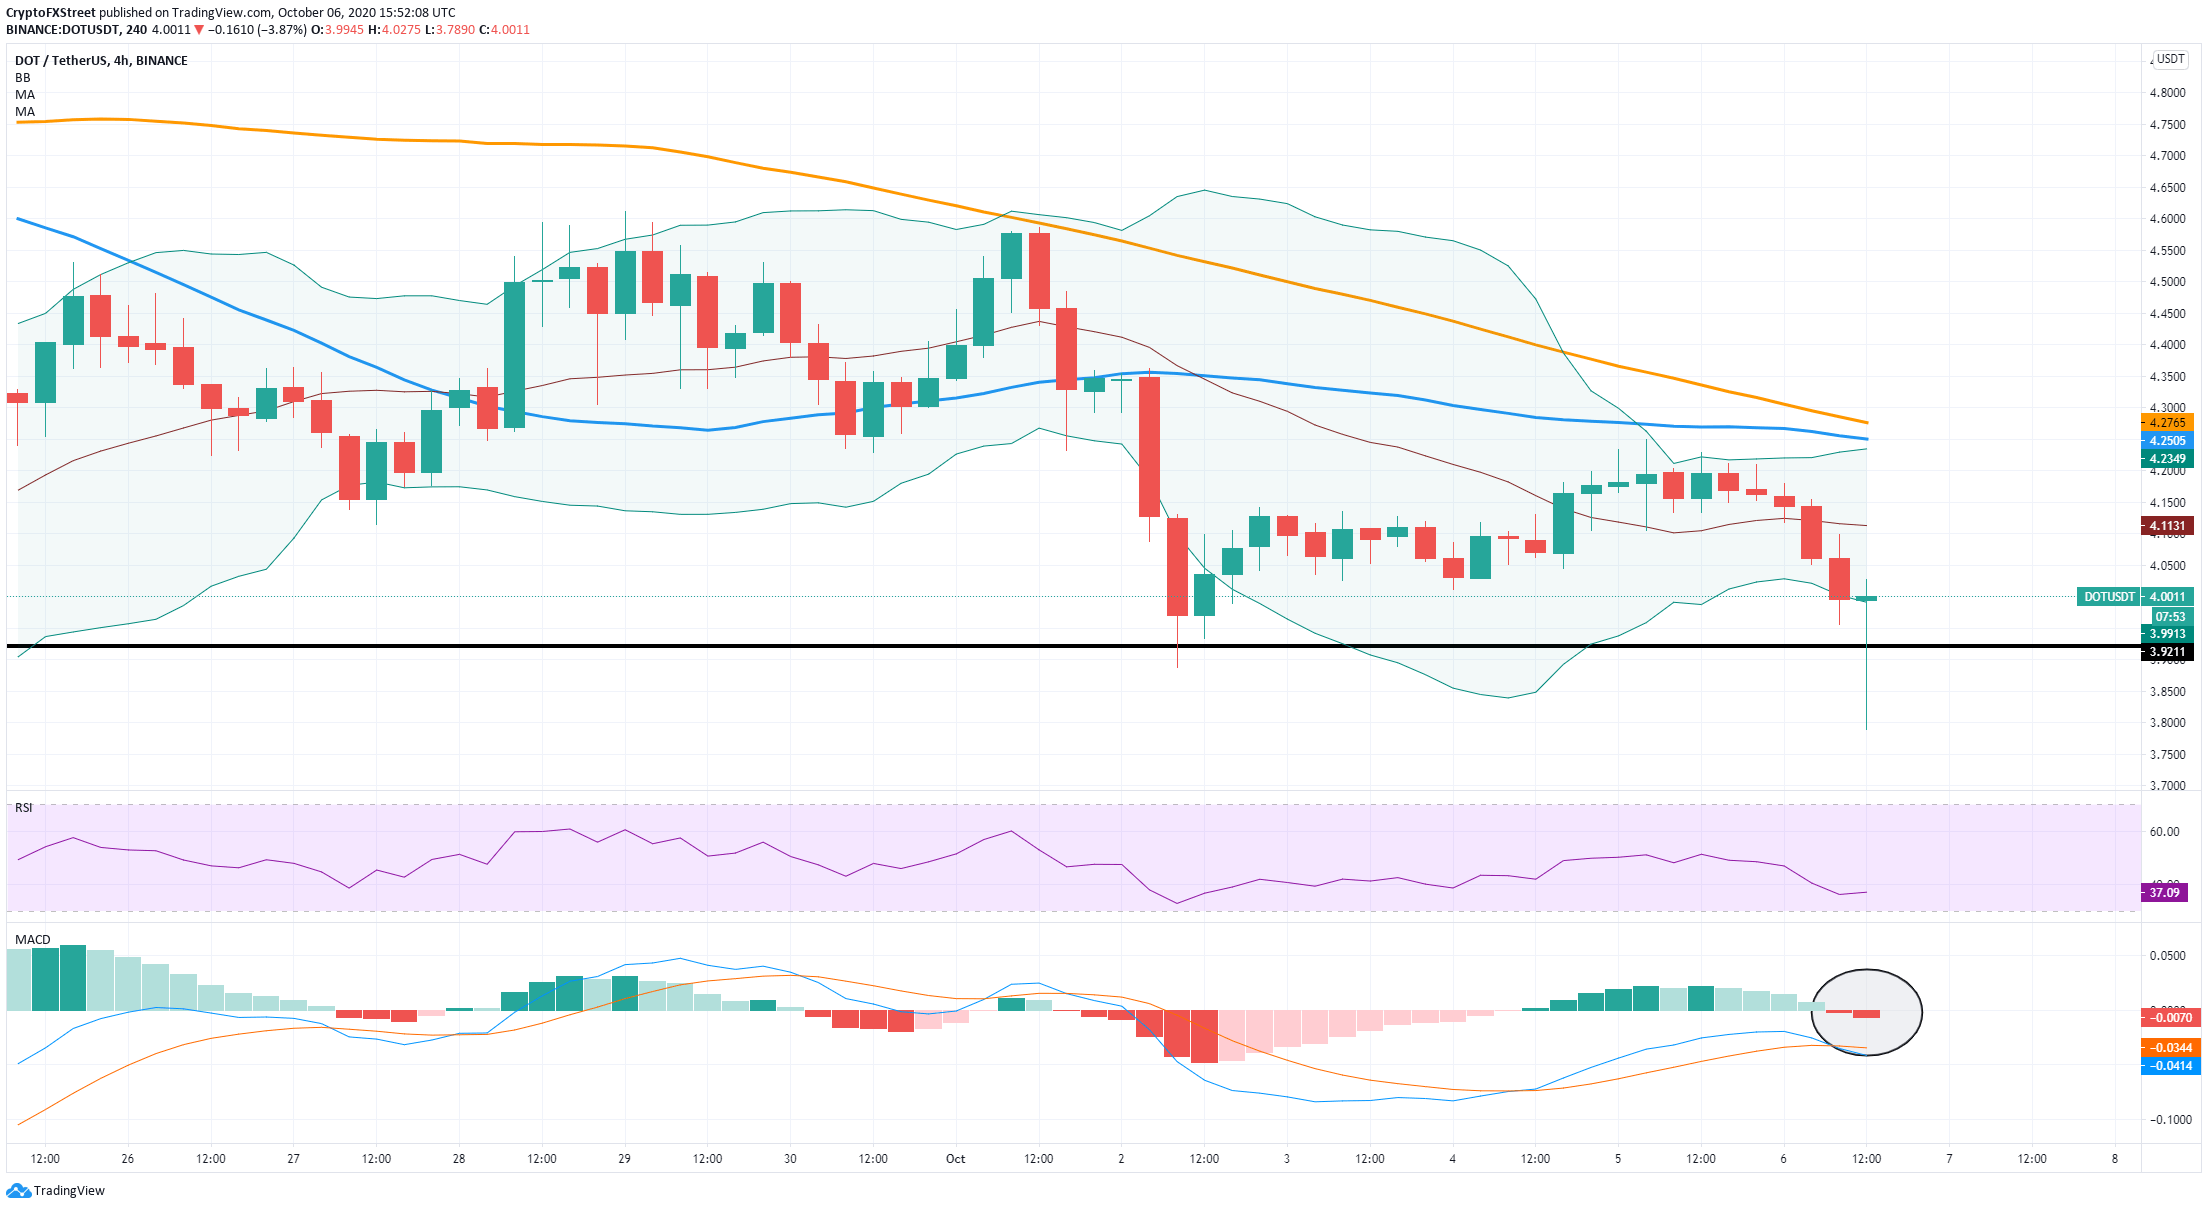
The price of DOT has already pierced the support level at $3.9 but managed to recover. The MACD turned bearish, which usually indicates continuation moves to the downside. Additionally, the Bollinger bands are squeezing a lot, meaning that a major price move is underway.
On the other hand, the last candlestick formed on the 4-hour chart has the potential to close as a bullish hammer candlestick. This candle indicates that buyers are interested in buying DOT at $3.9 and below, defending the support level and the lower Bollinger band.
If DOT gets bullish continuation after the close of the candlestick, the next price target can be $4.11, the middle of the BB indicator, and then $4.25 where the 50-SMA and the 100-SMA currently stand.
Key points to look for in the short-term
In essence, bears need to look out for a clear breakout below $3.9, which is the most critical support level. There is very little support below this point, which could lead DOT to a 50% decline towards $2
On the flip side, bulls were able to push DOT above $3.9 after the price touched $3.78, creating a potential bullish hammer candlestick on the 4-hour chart. A continuation move can take the digital asset up to $4.25 where the upper BB, the 50-SMA, and the 100-SMA are currently located.
Note: All information on this page is subject to change. The use of this website constitutes acceptance of our user agreement. Please read our privacy policy and legal disclaimer. Opinions expressed at FXstreet.com are those of the individual authors and do not necessarily represent the opinion of FXstreet.com or its management. Risk Disclosure: Trading foreign exchange on margin carries a high level of risk, and may not be suitable for all investors. The high degree of leverage can work against you as well as for you. Before deciding to invest in foreign exchange you should carefully consider your investment objectives, level of experience, and risk appetite. The possibility exists that you could sustain a loss of some or all of your initial investment and therefore you should not invest money that you cannot afford to lose. You should be aware of all the risks associated with foreign exchange trading, and seek advice from an independent financial advisor if you have any doubts.
Recommended Content
Editors’ Picks

IRS says crypto staking should be taxed in response to lawsuit
The IRS stated that rewards from cryptocurrency staking are taxable upon receipt, according to a Bloomberg report on Monday, which stated the agency rejected a legal argument that sought to delay taxation until such rewards are sold or exchanged.

Solana dominates Bitcoin, Ethereum in price performance and trading volume: Glassnode
Solana is up 6% on Monday following a Glassnode report indicating that SOL has seen more capital increase than Bitcoin and Ethereum. Despite the large gains suggesting a relatively heated market, SOL could still stretch its growth before establishing a top for the cycle.

Ethereum Price Forecast: ETH risks a decline to $3,000 as investors realize increased profits and losses
Ethereum is up 4% on Monday despite increased selling pressure across long-term and short-term holders in the past two days. If whales fail to maintain their recent buy-the-dip attitude, ETH risks a decline below $3,000.

Crypto Today: BTC hits new Trump-era low as Chainlink, HBAR and AAVE lead market recovery
The global cryptocurrency market cap shrank by $500 billion after the Federal Reserve's hawkish statements on December 17. Amid the market crash, Bitcoin price declined 7.2% last week, recording its first weekly timeframe loss since Donald Trump’s re-election.

Bitcoin: 2025 outlook brightens on expectations of US pro-crypto policy
Bitcoin price has surged more than 140% in 2024, reaching the $100K milestone in early December. The rally was driven by the launch of Bitcoin Spot ETFs in January and the reduced supply following the fourth halving event in April.

Best Forex Brokers with Low Spreads
VERIFIED Low spreads are crucial for reducing trading costs. Explore top Forex brokers offering competitive spreads and high leverage. Compare options for EUR/USD, GBP/USD, USD/JPY, and Gold.