![]() Lorenzo Stroe
Lorenzo Stroe
Independent Analyst
- DOT is currently trading at $4.04 right at the top of an important trendline on the daily chart.
- Rejection from this level into a breakout of the crucial support below can send DOT into a 50% correction.
Polkadot has been trading fairly sideways for the past month after reaching a massive market capitalization of $5.16 billion right after it started trading on September 3. Nonetheless, the digital currency is still ranked 8th at a $3.45 billion market cap.
Can DOT defend this significant support level to avoid slipping further?
Polkadot has established what seems to be a descending triangle on the daily chart. The upper boundary of this pattern has rejected the price of DOT several times in the past on September 18, October 10, and on five more occasions since then.
DOT/USDT daily chart
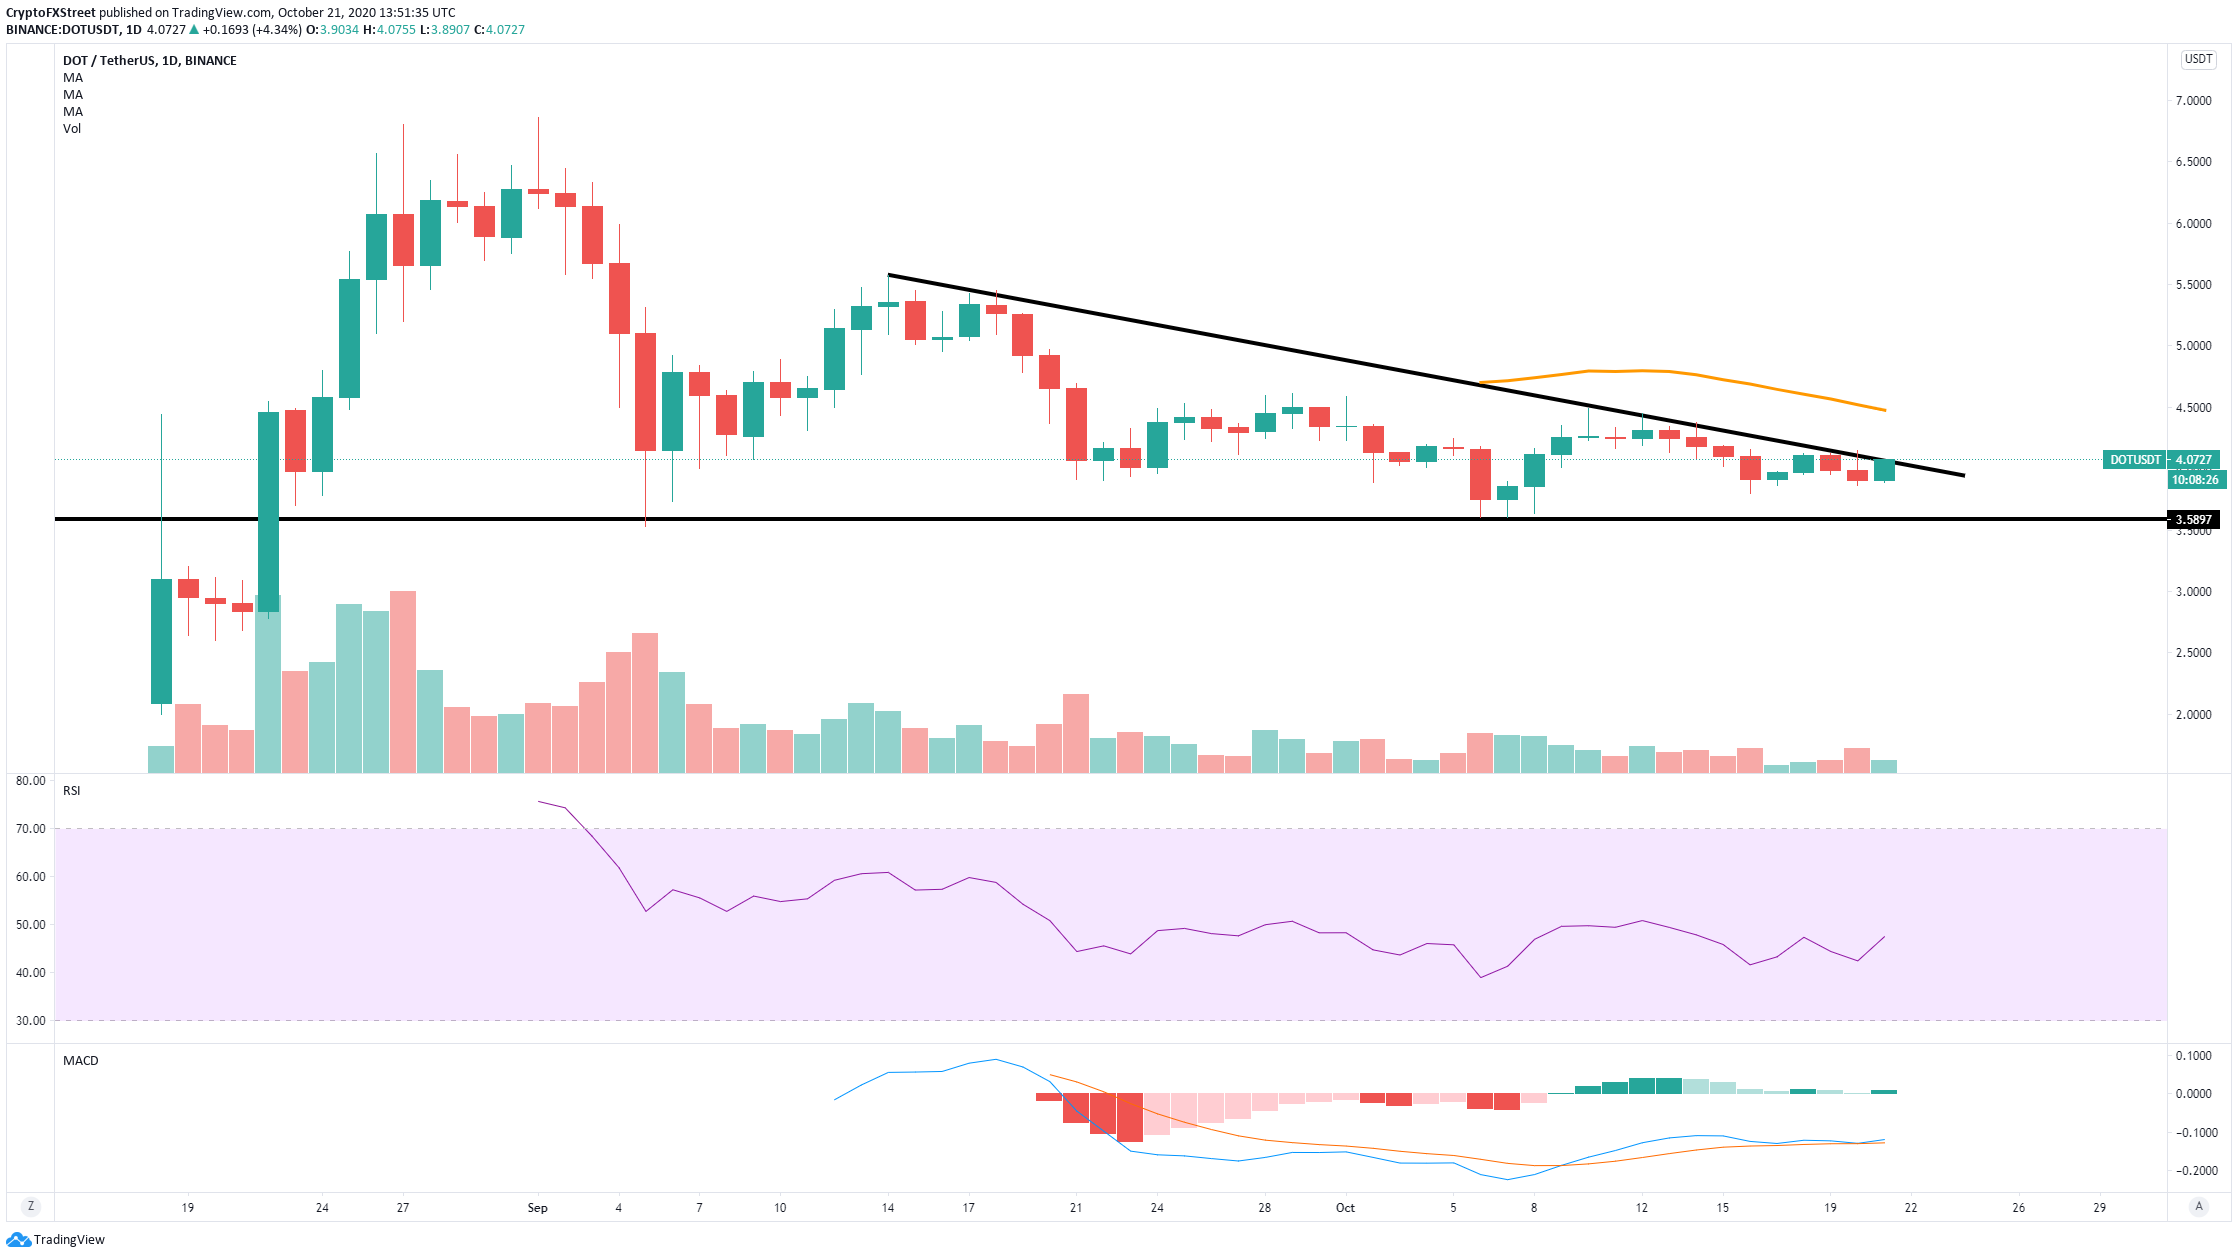
The price is currently right at the upper boundary of the pattern again. Another rejection can easily drive the price towards the support at $3.58, but most importantly, a breakout below this point can send DOT into a 50% correction down to $1.8.
DOT/USDT 1-hour chart
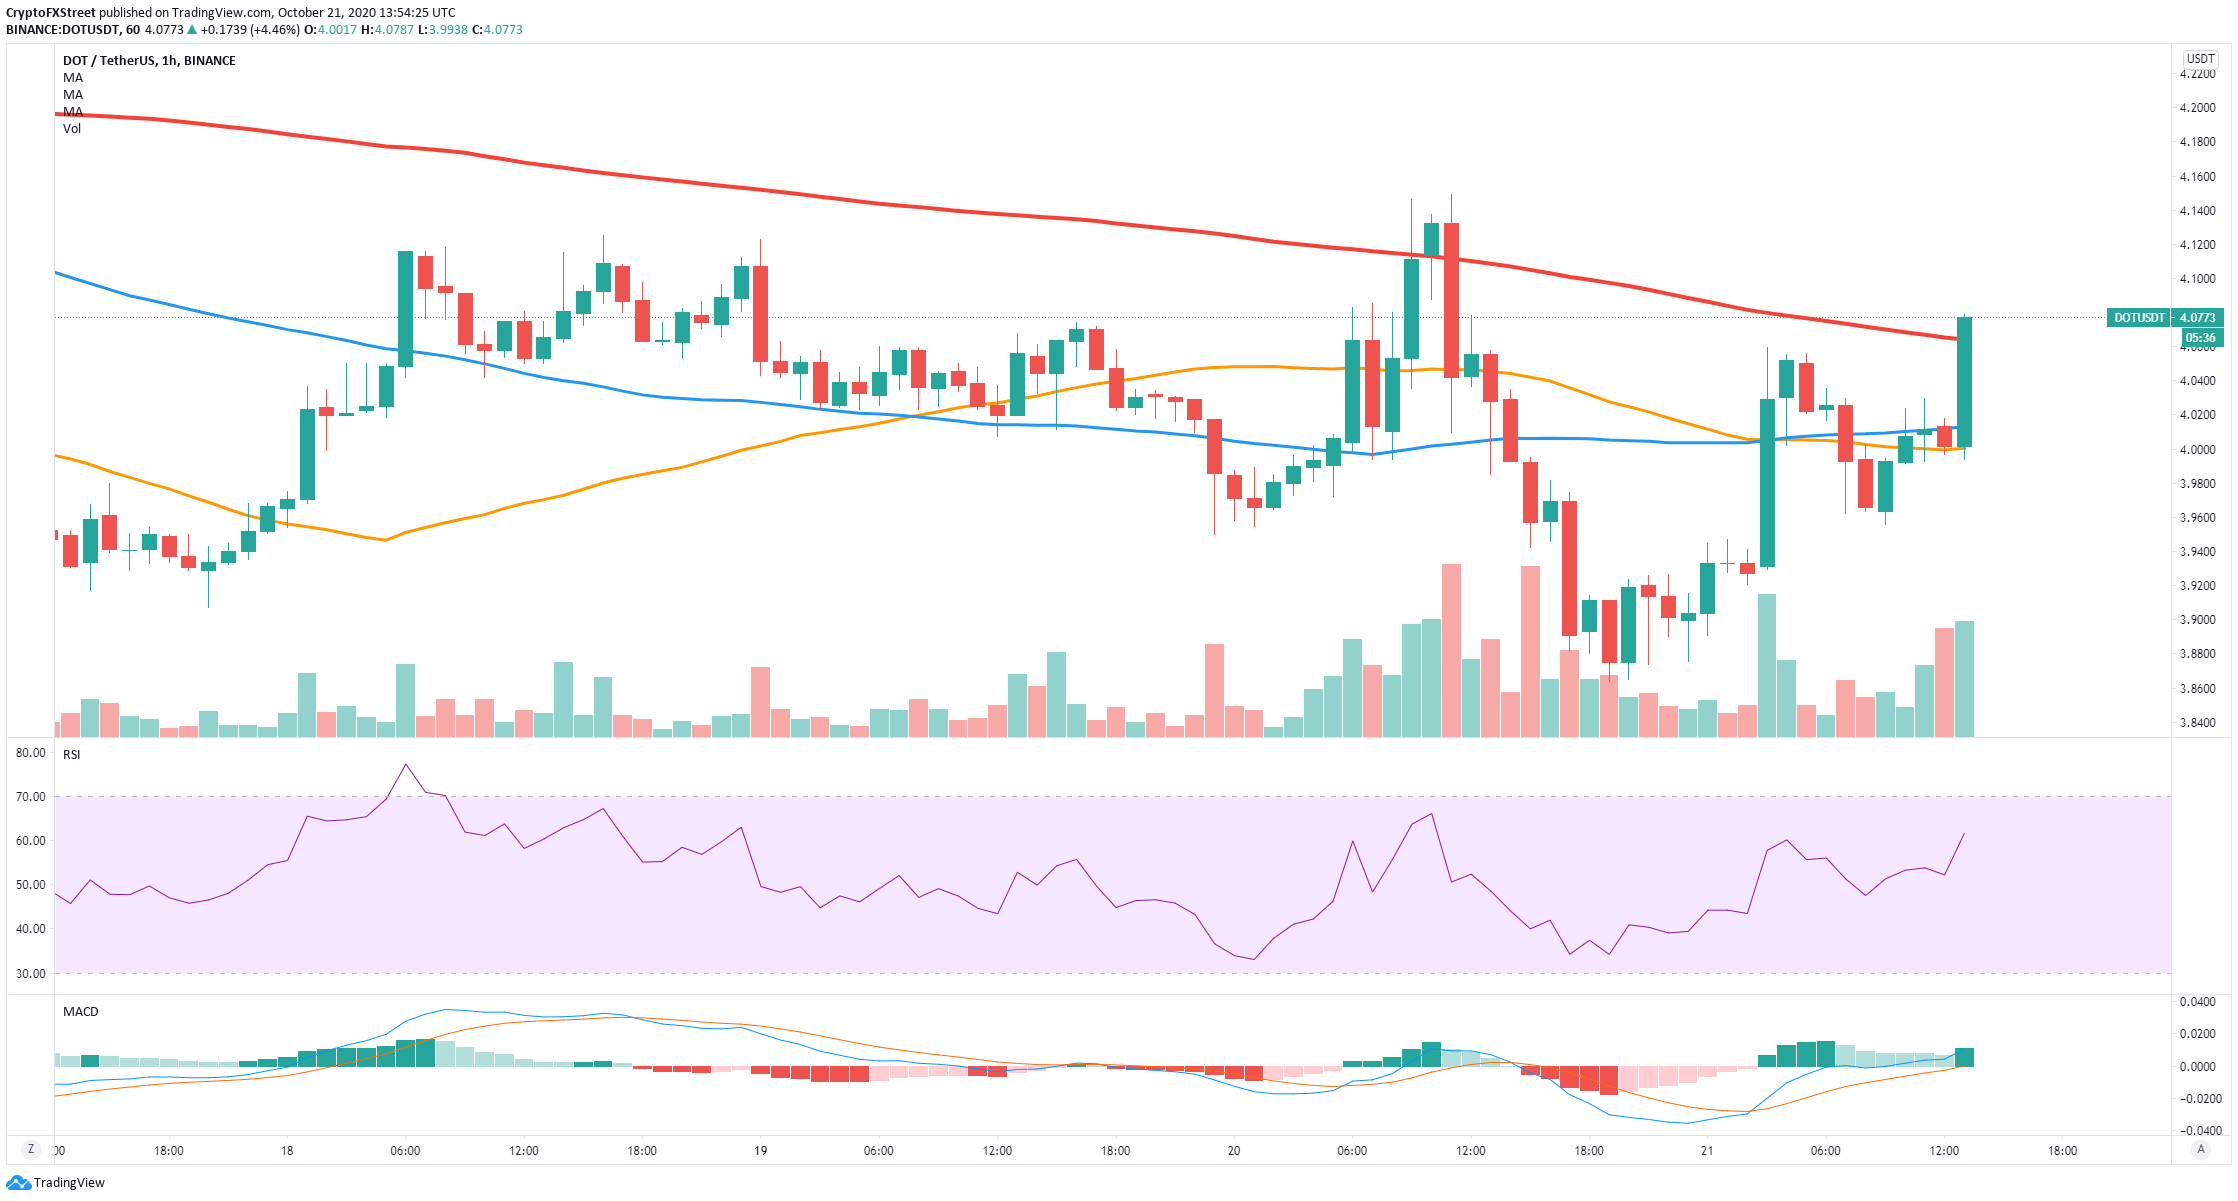
Despite the pessimistic outlook on the daily chart, the hourly chart has flipped in favor of the bulls after the price climbed above the 50-SMA and the 100-SMA, and more recently the 200-SMA. The MACD also turned bullish around 12 hours ago and it’s gaining strength.
The confirmed hourly uptrend after several higher lows and higher highs gives buyers a lot of strength in the short-term. Of course, a bullish breakout from the daily descending triangle pattern will have the same consequences but to the upside towards $4.5.
Polkadot critical price points
The descending triangle formed on the daily chart is by far the most important pattern to keep in mind. A bearish breakout below the support level at $3.58 can easily drive the price of DOT down to $1.8, approximately a 50% pullback.
On the other hand, bulls are taking control over the short-term timeframes. Similarly, a breakout above the upper trendline of the triangle pattern can push DOT towards a high of $4.5, where the 50-SMA on the daily chart is established currently.
Note: All information on this page is subject to change. The use of this website constitutes acceptance of our user agreement. Please read our privacy policy and legal disclaimer. Opinions expressed at FXstreet.com are those of the individual authors and do not necessarily represent the opinion of FXstreet.com or its management. Risk Disclosure: Trading foreign exchange on margin carries a high level of risk, and may not be suitable for all investors. The high degree of leverage can work against you as well as for you. Before deciding to invest in foreign exchange you should carefully consider your investment objectives, level of experience, and risk appetite. The possibility exists that you could sustain a loss of some or all of your initial investment and therefore you should not invest money that you cannot afford to lose. You should be aware of all the risks associated with foreign exchange trading, and seek advice from an independent financial advisor if you have any doubts.
Recommended Content
Editors’ Picks

Is Altcoin Season here as Bitcoin reaches a new all-time high?
Bitcoin reaches a new all-time high of $98,384 on Thursday, with altcoins following the suit. Reports highlight that the recent surge in altcoins was fueled by the victory of crypto-friendly candidate Donal Trump in the US presidential election.

Shanghai court confirms legal recognition of crypto ownership
A Shanghai court has confirmed that owning digital assets, including Bitcoin, is legal under Chinese law. Judge Sun Jie of the Shanghai Songjiang People’s Court shared this opinion through the WeChat account of the Shanghai High People’s Court.
BTC hits an all-time high above $97,850, inches away from the $100K mark
Bitcoin hit a new all-time high of $97,852 on Thursday, and the technical outlook suggests a possible continuation of the rally to $100,000. BTC futures have surged past the $100,000 price mark on Deribit, and Lookonchain data shows whales are accumulating.
Shiba Inu holders withdraw 1.67 trillion SHIB tokens from exchange
Shiba Inu trades slightly higher, around $0.000024, on Thursday after declining more than 5% the previous week. SHIB’s on-chain metrics project a bullish outlook as holders accumulate recent dips, and dormant wallets are on the move, all pointing to a recovery in the cards.
Bitcoin: New high of $100K or correction to $78K?
Bitcoin surged to a new all-time high of $93,265 in the first half of the week, followed by a slight decline in the latter half. Reports highlight that Bitcoin’s current level is still not overvalued and could target levels above $100,000 in the coming weeks.

Best Forex Brokers with Low Spreads
VERIFIED Low spreads are crucial for reducing trading costs. Explore top Forex brokers offering competitive spreads and high leverage. Compare options for EUR/USD, GBP/USD, USD/JPY, and Gold.