![]() Sheldon McIntyre, CMT
Sheldon McIntyre, CMT
Independent Analyst
- Polkadot price struggling to overcome resistance at the 200-day simple moving average (SMA).
- February 23 and April 23 lows create a significant technical challenge.
- Lack of support leaves DOT vulnerable to a new wave of liquidation in the cryptocurrency market.
Polkadot price has not identified any price traction above $25.90 since the rebound from the May 23 low. The range of resistance defined by the 200-day SMA at $23.57 and $25.90 may continue to stifle DOT bounces in the short term, encouraging investors to study opportunities from a long and short perspective.
Polkadot price has yet to show healthy accumulation
Polkadot price will close May with a 36% loss after falling over 70% from the May 15 high at $50.74 to the May 23 low at $13.59. The volatility included a 60% collapse on May 19 before rebounding later in the day. The low of the correction undercut the 78.6% Fibonacci retracement of the 2021 rally at $14.89.
DOT did rebound close to 100% from the May 23 low to the May 28 high at $26.66 before falling below the 200-day SMA again. The strategically important moving average has played a role in Polkadot price for most of the days since May 23, establishing it as an essential determinant for the long-term direction of the digital asset.
Polkadot price strength will likely be contained to the 200-day SMA until a credible base can be identified on a relevant timeframe. Based on the speed of the decline, DOT is combating elevated levels of price compression that need to be released before it can attract more committed investors.
If Polkadot price does overcome the moving average at $23.57, it will quickly hit superior resistance at $25.90, a level just above the April 23 low at $25.82 and the February 23 low at $25.87. From May 26-28, DOT reversed near the price level, fortifying its importance in the narrative.
A daily close above $25.90 would encourage investors to consider higher resistance levels, beginning with the 38.2% Fibonacci retracement at $27.78 and then the 50% retracement at $32.16. Ambitious investors will strike resistance at the declining 50-day SMA at $34.05.
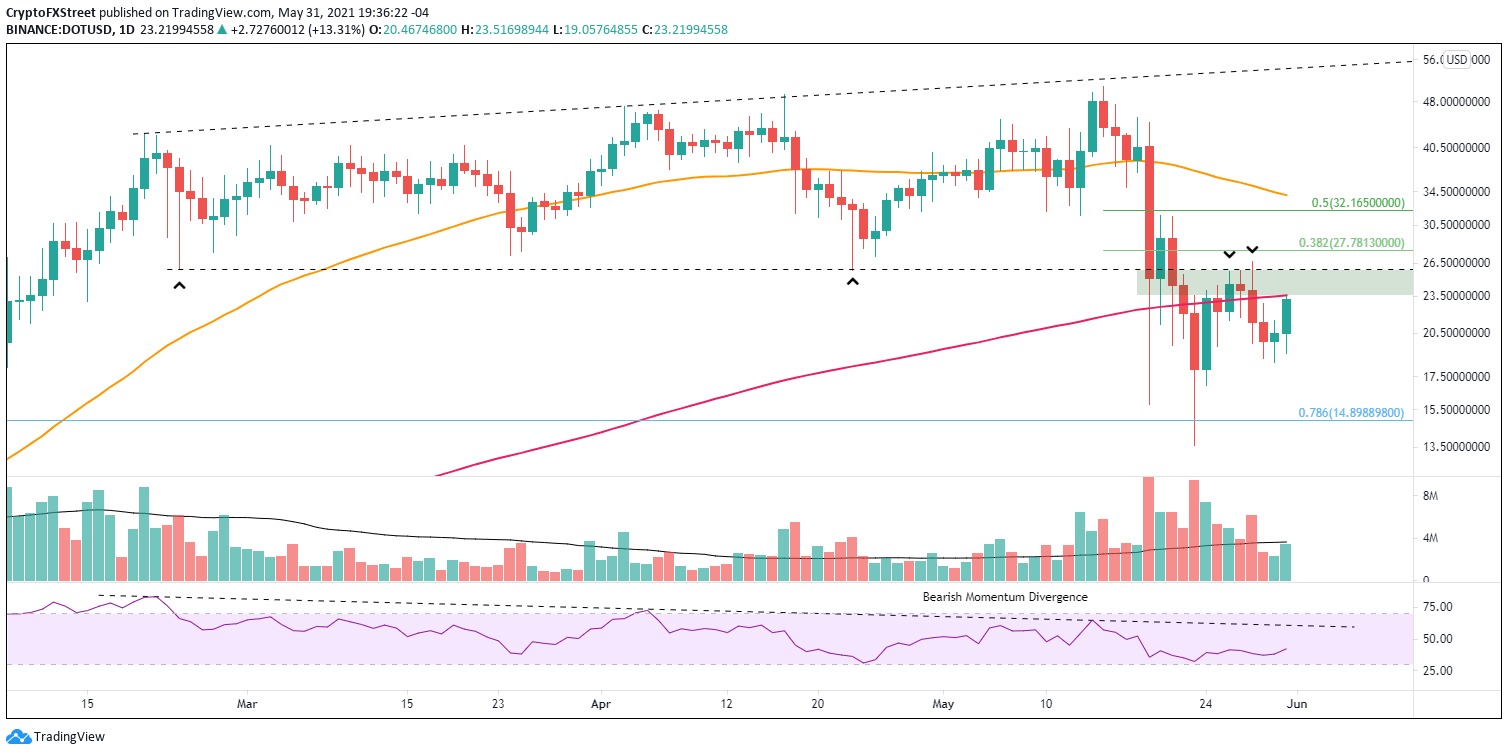
DOT/USD daily chart
Since Polkadot price is trading below a critical moving average, it is advisable to consider the downside. DOT has few notable support levels, except for the May 30 low at $18.39, representing a 20% decline, and then the May 24 low at $16.94. Any weakness beyond those prices confirms the cryptocurrency still has not recorded a definitive correction low.
With the upside resistance clearly defined and only minor support, there is a high probability that Polkadot price is exposed to further losses.
Note: All information on this page is subject to change. The use of this website constitutes acceptance of our user agreement. Please read our privacy policy and legal disclaimer. Opinions expressed at FXstreet.com are those of the individual authors and do not necessarily represent the opinion of FXstreet.com or its management. Risk Disclosure: Trading foreign exchange on margin carries a high level of risk, and may not be suitable for all investors. The high degree of leverage can work against you as well as for you. Before deciding to invest in foreign exchange you should carefully consider your investment objectives, level of experience, and risk appetite. The possibility exists that you could sustain a loss of some or all of your initial investment and therefore you should not invest money that you cannot afford to lose. You should be aware of all the risks associated with foreign exchange trading, and seek advice from an independent financial advisor if you have any doubts.
Recommended Content
Editors’ Picks

Cronos Price Prediction: CRO rallies as roadmap includes plans for ETF and Strategic Reserve
Cronos (CRO) price extends its gains by 7%, trading around $0.086 on Thursday after rallying nearly 8% the previous day. Cronos invites its community to vote for its ambitious proposal to establish Cronos ETF and Cronos Strategic Reserve. Moreover, Santiment data shows that certain whales accumulated CRO tokens during the recent price dip.

Bitcoin Price Forecast: BTC expects volatility around White House Crypto summit
Bitcoin price hovers around $87,600 on Wednesday after finding support around $85,000 the previous day. US spot Exchange Traded Funds continued their outflows this week, totaling $217.7 million until Tuesday and signaling institutional demand weakness.

Bitcoin Cash Price Forecast: BCH rallies as transaction rate reaches a new all-time high
Bitcoin Cash’s price rallies more than 7% on Wednesday after retesting its key support the previous day. On-chain metrics paint a bullish picture as BCH’s transaction rate reaches a new high, and open interest is also rising.

BTC, ETH and XRP signal recovery ahead of White House Crypto Summit
Bitcoin price faced rejection around the $95,000 level on Sunday and declined 8.54% the next day. However, on Tuesday, BTC dipped below the daily support level at $85,000 but bounces and closes above it.

Bitcoin: BTC bloodbath continues, near 30% down from its ATH
Bitcoin (BTC) price extends its decline and trades below $80,000 at the time of writing on Friday, falling over 15% so far this week. This price correction wiped $660 billion of market capitalization from the overall crypto market and saw $3.68 billion in total liquidations this week.

The Best brokers to trade EUR/USD
SPONSORED Discover the top brokers for trading EUR/USD in 2025. Our list features brokers with competitive spreads, fast execution, and powerful platforms. Whether you're a beginner or an expert, find the right partner to navigate the dynamic Forex market.