Polkadot Price Prediction: DOT eyes 24% gains
- Polkadot price saw an influx of selling pressure at the supply barrier ranging from $42 to $44.06, putting an end to its upswing.
- After a brief consolidation, DOT crashed 23% but failed to test the demand barrier’s upper boundary at $31.30
- A retest of this support zone will provide the buyers an extra oomph to catapult it up by 24%.

Polkadot price faced rejection at a crucial supply barrier, but the latest market crash amplified this sell-off. DOT is currently awaiting retest of a key supply level before surging higher.
Polkadot price needs a higher high
Polkadot price has crashed nearly 20% in a single 12-hour candlestick and eyes a further drop toward a crucial demand barrier that extends from $28.10 to $31.30. This downtrend move will allow the sidelined investors to jump on the DOT bandwagon.
The resulting upswing could extend 24% to tag the first supply barrier that extends from $38.9 to $41. If the buying pressure is enough for Polkadot price to produce a 12-hour candlestick close above this zone, DOT could pierce the following resistance area that stretches from $42 to $44.06.
Under exceptional circumstances, the DeFi coin could even sweep the swing high at $45.49 or $48.36.
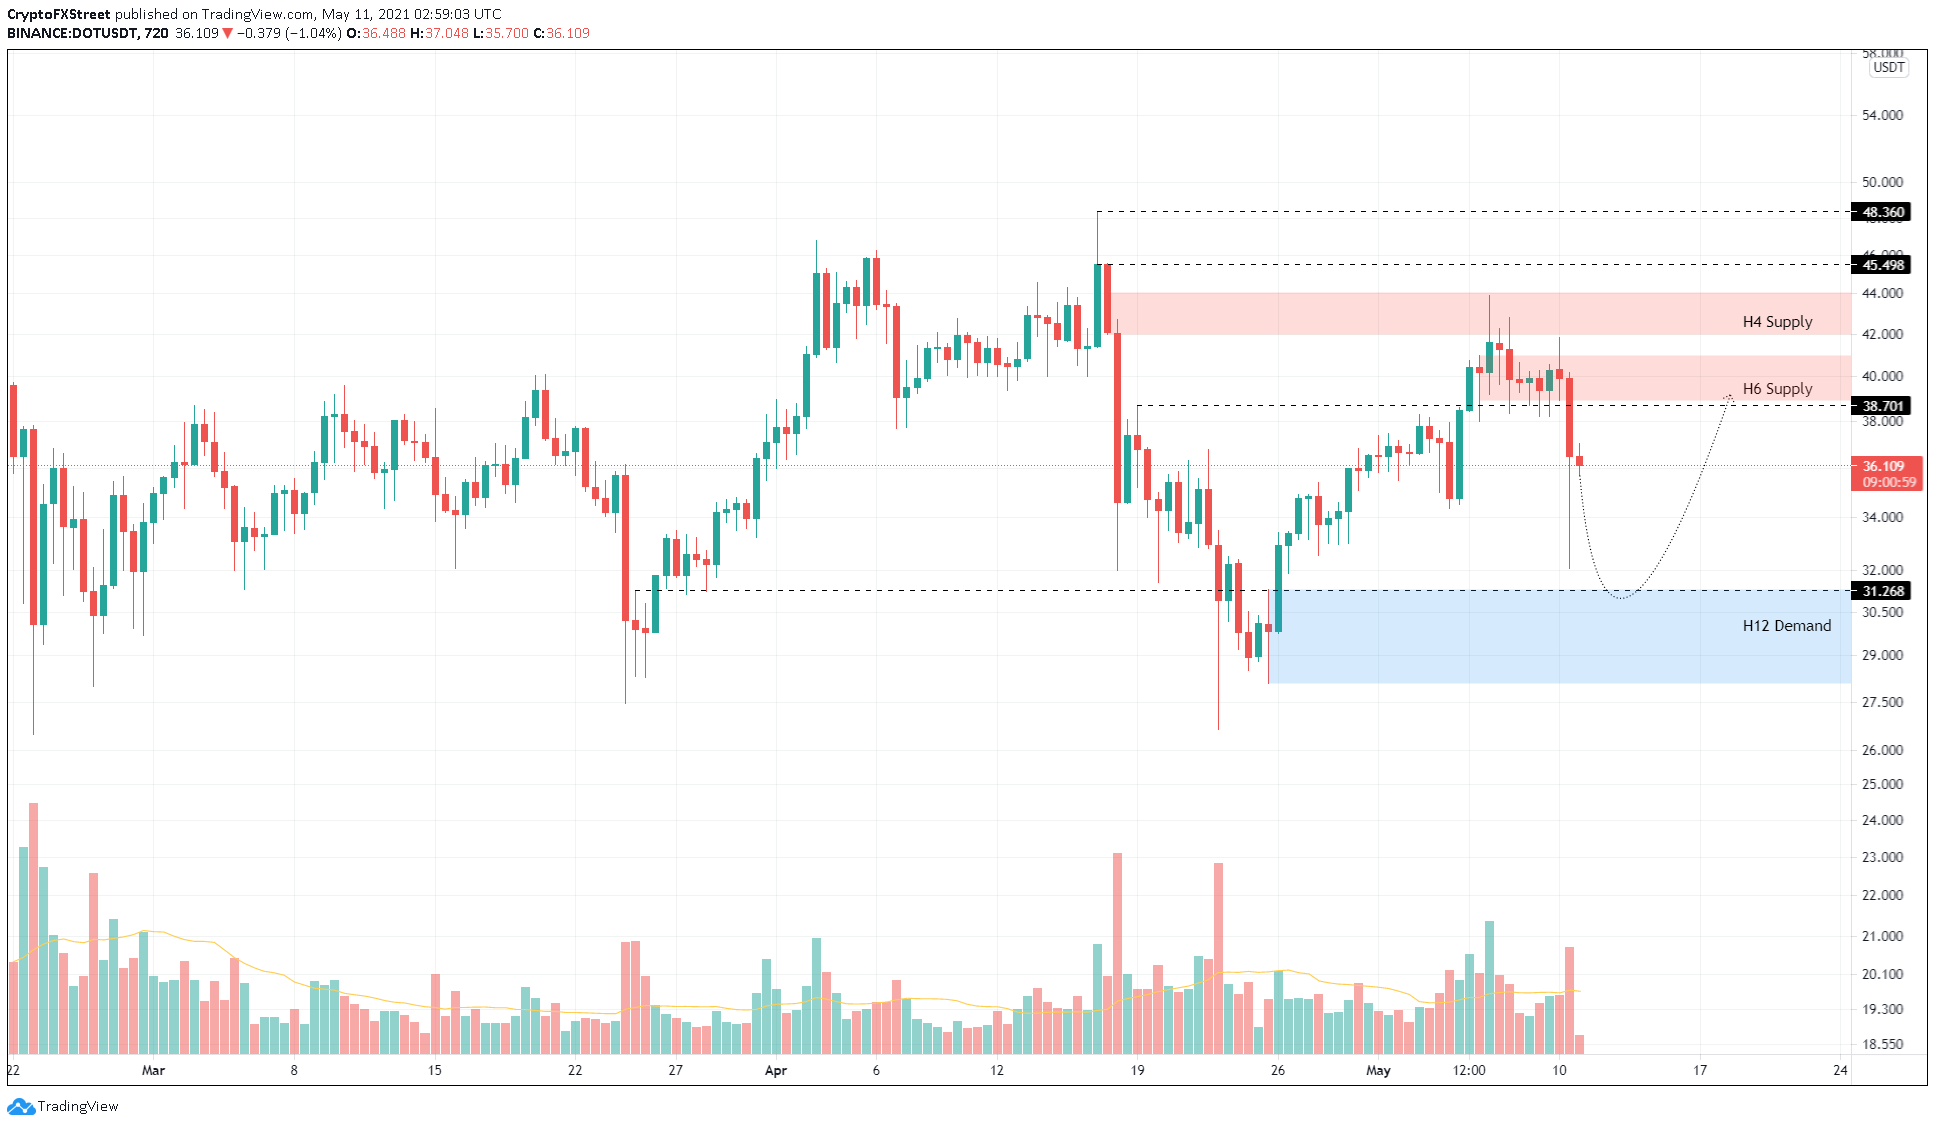
DOT/USDT 12-hour chart
If the demand barrier’s lower boundary at $28.10 is breached, it will signal extraordinary selling pressure. However, a solid close below $27.75 will invalidate the bullish thesis and kick-start a bearish one.
In such a condition, investors could expect Polkadot price to enter a 12% downtrend to $24.14.
Author

Akash Girimath
FXStreet
Akash Girimath is a Mechanical Engineer interested in the chaos of the financial markets. Trying to make sense of this convoluted yet fascinating space, he switched his engineering job to become a crypto reporter and analyst.


