Polkadot Price Prediction: DOT awaits trigger for 30% gains
- Polkadot price is currently hovering above a crucial support level at $31.38.
- A successful bounce from this demand area will propel DOT to $42.71.
- If the support floor at $23.46 is breached, it will invalidate the bullish thesis.

Polkadot price recently sliced through a critical supply barrier, indicating a resurgence of buying pressure. DOT is likely to experience another leg-up if this momentum continues to hold, which could even retest the all-time high in a highly bullish case.
Polkadot price to kick-start a new upswing
Polkadot price has been on an exponential rise over the past week and shows that more is on its way. The climb from $23.46 to $33.86 shattered the overhead barrier at $31.38 and is currently testing it. A successful bounce from this foothold will indicate that the bulls are in control.
In such a case, DOT will likely rally 17% to tag the $38.83 resistance level. Further increase in bid orders could propel Polkadot price to $42.71. This climb, in total, would constitute a 30% ascent from the current price.
Market participants need to note that a further upswing to retest the all-time high at $50.03 is not outside the realm of possibility. However, what’s likely is a minor retracement to allow sidelined buyers to jump on the bandwagon before the retest of the all-time high.
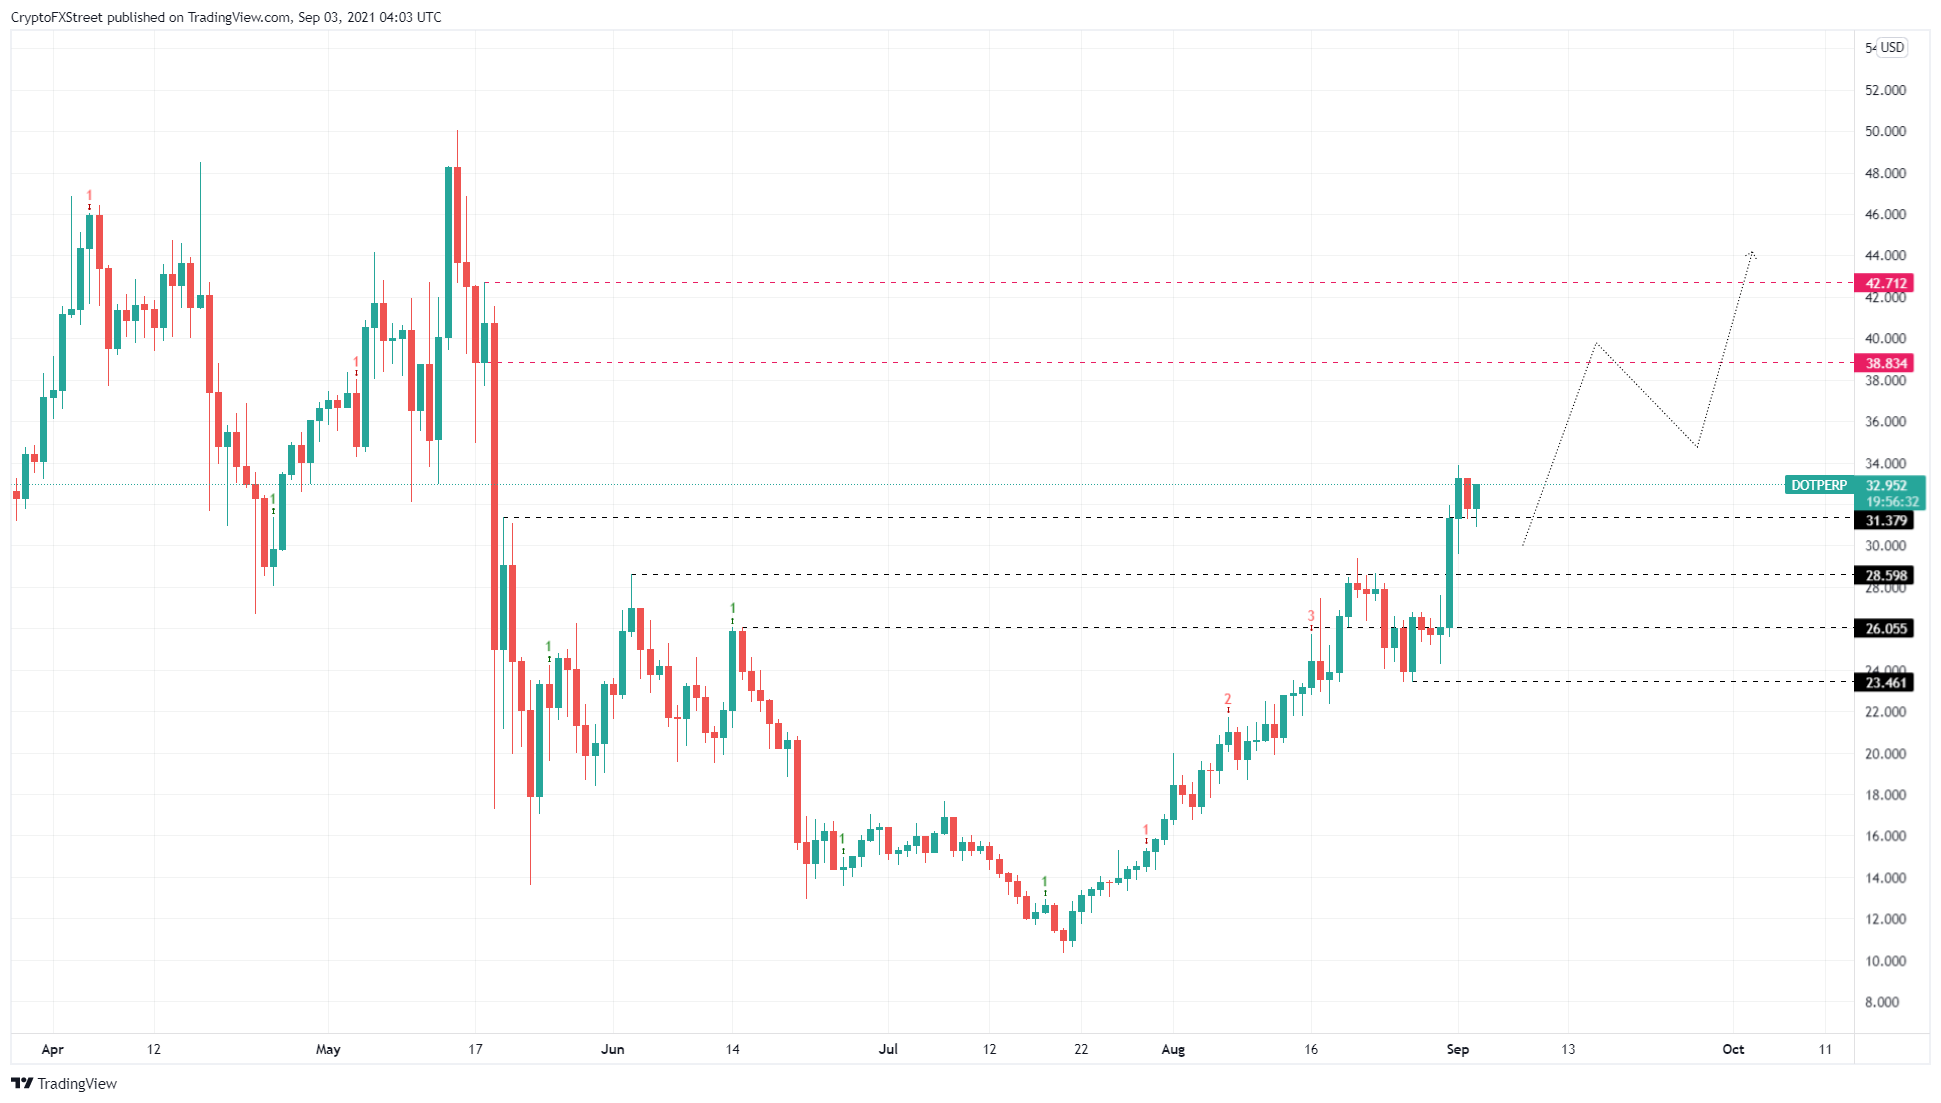
DOT/USDT 1-day chart
Regardless of the recent upswing, a breakdown of the $31.38 support floor will indicate that the sellers are more in number than buyers and will likely exacerbate the retracement to $28.60.
If the sell-off produces a lower low below $23.46, it will invalidate the bullish thesis and open the possibility of a further crash.
Author

Akash Girimath
FXStreet
Akash Girimath is a Mechanical Engineer interested in the chaos of the financial markets. Trying to make sense of this convoluted yet fascinating space, he switched his engineering job to become a crypto reporter and analyst.


