- Polkadot price is up 80% since October 18 when the crypto market turned bullish.
- DOT risks a 5% correction, or worse if it fails to overcome the supply barrier extending from $7.236 to $7.575.
- Invalidation of the bearish outlook will occur upon a decisive candlestick close above the mean threshold at $7.424, bringing $7.900 to focus.
Polkadot (DOT) price is among the biggest gainers since the market turned bullish around October 18, recording a significant climb as traders and investors shelved their profit-booking appetite. However, all things could go brrrr now that the price confronts a formidable supplier congestion zone.
Also Read: Polkadot Price Forecast: A correction or second coming for DOT holders?
Polkadot risks a 5% correction but the bulls are still in play
Polkadot (DOT) price is up 80% since October 18, but now confronts a supply zone stretching from $ 7.236 to $.575. To confirm the continuation of the intermediate trend, the price must record a daily candlestick close above the mean threshold of this order block above $7.424.
The Relative Strength Index (RSI) shows DOT is already massively overbought, at 83, but its trajectory or orientation to the north suggests buying momentum continues to rise. Similarly, the histogram bars of the Awesome Oscillator (AO) remain in the positive territory with large green volumes, solidifying the presence of the bulls in the DOT market.
Increased buying pressure could see Polkadot price overcome the $7.424 roadblock, flipping the supply zone into a bullish breaker by retesting the $7.900 range high. Notably, this level was last tested on February 19. Such a move would constitute a 7% climb above current levels.
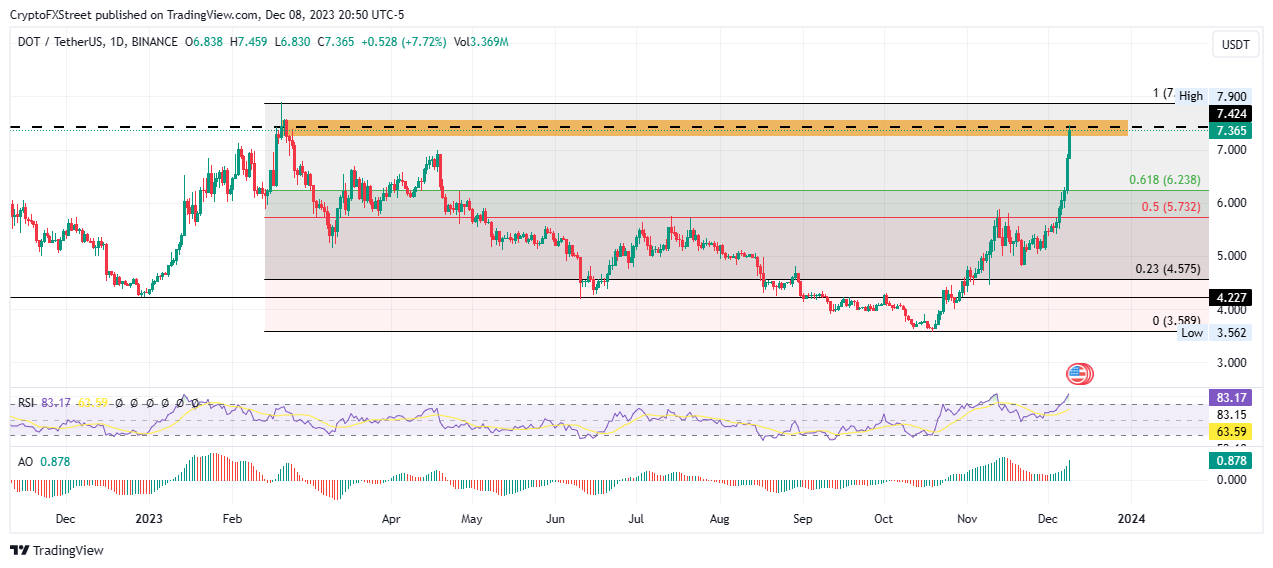
DOT/USDT 1-day chart
On the flip side, if the supply barrier holds as a resistance block, Polkadot price could face a rejection, retracting 5% to the $7.000 psychological or worse, retracing the most important Fibonacci level, 61.8%, at $6.238. In the dire case, the slump could extend to the 50% Fibonacci retracement level at$5.732. Such a move would constitute a 20% correction.
Information on these pages contains forward-looking statements that involve risks and uncertainties. Markets and instruments profiled on this page are for informational purposes only and should not in any way come across as a recommendation to buy or sell in these assets. You should do your own thorough research before making any investment decisions. FXStreet does not in any way guarantee that this information is free from mistakes, errors, or material misstatements. It also does not guarantee that this information is of a timely nature. Investing in Open Markets involves a great deal of risk, including the loss of all or a portion of your investment, as well as emotional distress. All risks, losses and costs associated with investing, including total loss of principal, are your responsibility. The views and opinions expressed in this article are those of the authors and do not necessarily reflect the official policy or position of FXStreet nor its advertisers. The author will not be held responsible for information that is found at the end of links posted on this page.
If not otherwise explicitly mentioned in the body of the article, at the time of writing, the author has no position in any stock mentioned in this article and no business relationship with any company mentioned. The author has not received compensation for writing this article, other than from FXStreet.
FXStreet and the author do not provide personalized recommendations. The author makes no representations as to the accuracy, completeness, or suitability of this information. FXStreet and the author will not be liable for any errors, omissions or any losses, injuries or damages arising from this information and its display or use. Errors and omissions excepted.
The author and FXStreet are not registered investment advisors and nothing in this article is intended to be investment advice.
Recommended Content
Editors’ Picks

Dogecoin and Bitcoin Cash Price Prediction: Funding rates decrease indicate weakness in DOGE and BCH
Dogecoin and Bitcoin Cash registered 3% and 8% losses on Tuesday following increased selling pressure from the futures market. The decline comes amid large-cap cryptos like Bitcoin, Ether and XRP, holding still with slight gains.

XRP could sustain rally amid growing ETF and SEC vote prospects
Ripple flaunted a bullish outlook, trading at $2.1505 on Tuesday. Investor risk appetite has continued to grow since the middle of last week, propping XRP for a sustainable upward move triggered by the swift decision by US President Donald Trump to suspend reciprocal tariffs for 90 days.

VeChain Price Forecast: VET bulls aim for a double-digit rally
VeChain price hovers around $0.023 on Tuesday after breaking above a falling wedge pattern the previous day; a breakout of this pattern favors the bulls. Bybit announced on Monday that VET would be listed on its exchange. Moreover, the technical outlook suggests rallying ahead, targeting double-digit gains.
Dogecoin, Shiba Inu and Fartcoin price prediction if Bitcoin crosses $100K this week
The meme coin market fell sharply on Monday, shedding 4.8% in market capitalization to settle at $49.25 billion, according to data compiled from CoinGecko. The sell-off coincided with increased volatility across broader crypto markets while investors rotated funds into Bitcoin briefly tested $85,000.

Bitcoin Weekly Forecast: Market uncertainty lingers, Trump’s 90-day tariff pause sparks modest recovery
Bitcoin (BTC) price extends recovery to around $82,500 on Friday after dumping to a new year-to-date low of $74,508 to start the week. Market uncertainty remains high, leading to a massive shakeout, with total liquidations hitting $2.18 billion across crypto markets.

The Best brokers to trade EUR/USD
SPONSORED Discover the top brokers for trading EUR/USD in 2025. Our list features brokers with competitive spreads, fast execution, and powerful platforms. Whether you're a beginner or an expert, find the right partner to navigate the dynamic Forex market.