Polkadot price on edge, slight bearish wind could trigger a 20% nosedive
- Polkadot price action between September 10 and October 10 has created a bear flag.
- The pattern forecasts a 21% crash to $4.88 on the breakdown of the $6.19 support level.
- A daily candlestick close above $6.48 will invalidate the bearish theiss for DOT.

Polkadot price shows a full-fledged bearish continuation pattern that could trigger a steep decline if buyers do not intervene. If, as expected, bulls fail to step in, investors should prepare for a sharp correction for DOT.
Polkadot price at crossroads
Polkadot price witnessed a 21% retracement between September 10 and 13, which pushed it from a high of $7.77 to a low of $6.19. Following this sudden bearish impulse, a stagnation period began that saw DOT consolidate and form a sideways rectangular pattern.
Taken altogether, the market activity outlined above describes a ‘bear flag’, with the initial downswing as the flagpole and the consolidation that followed the flag. This technical formation suggests a continuation of the bear trend with a 21% up for grabs if the flag’s base at roughly $6.19 is breached.
This pessimistic target is determined by adding the flagpole’s height to the breakout point and extrapolating it down – the eventual end target for Polkadot price is actually lower, at $4.88.
Notwithstanding these idealized targets, investors should keep a close eye on the $5.40 support level, where buyers have a chance to step in and attempt a reversal.
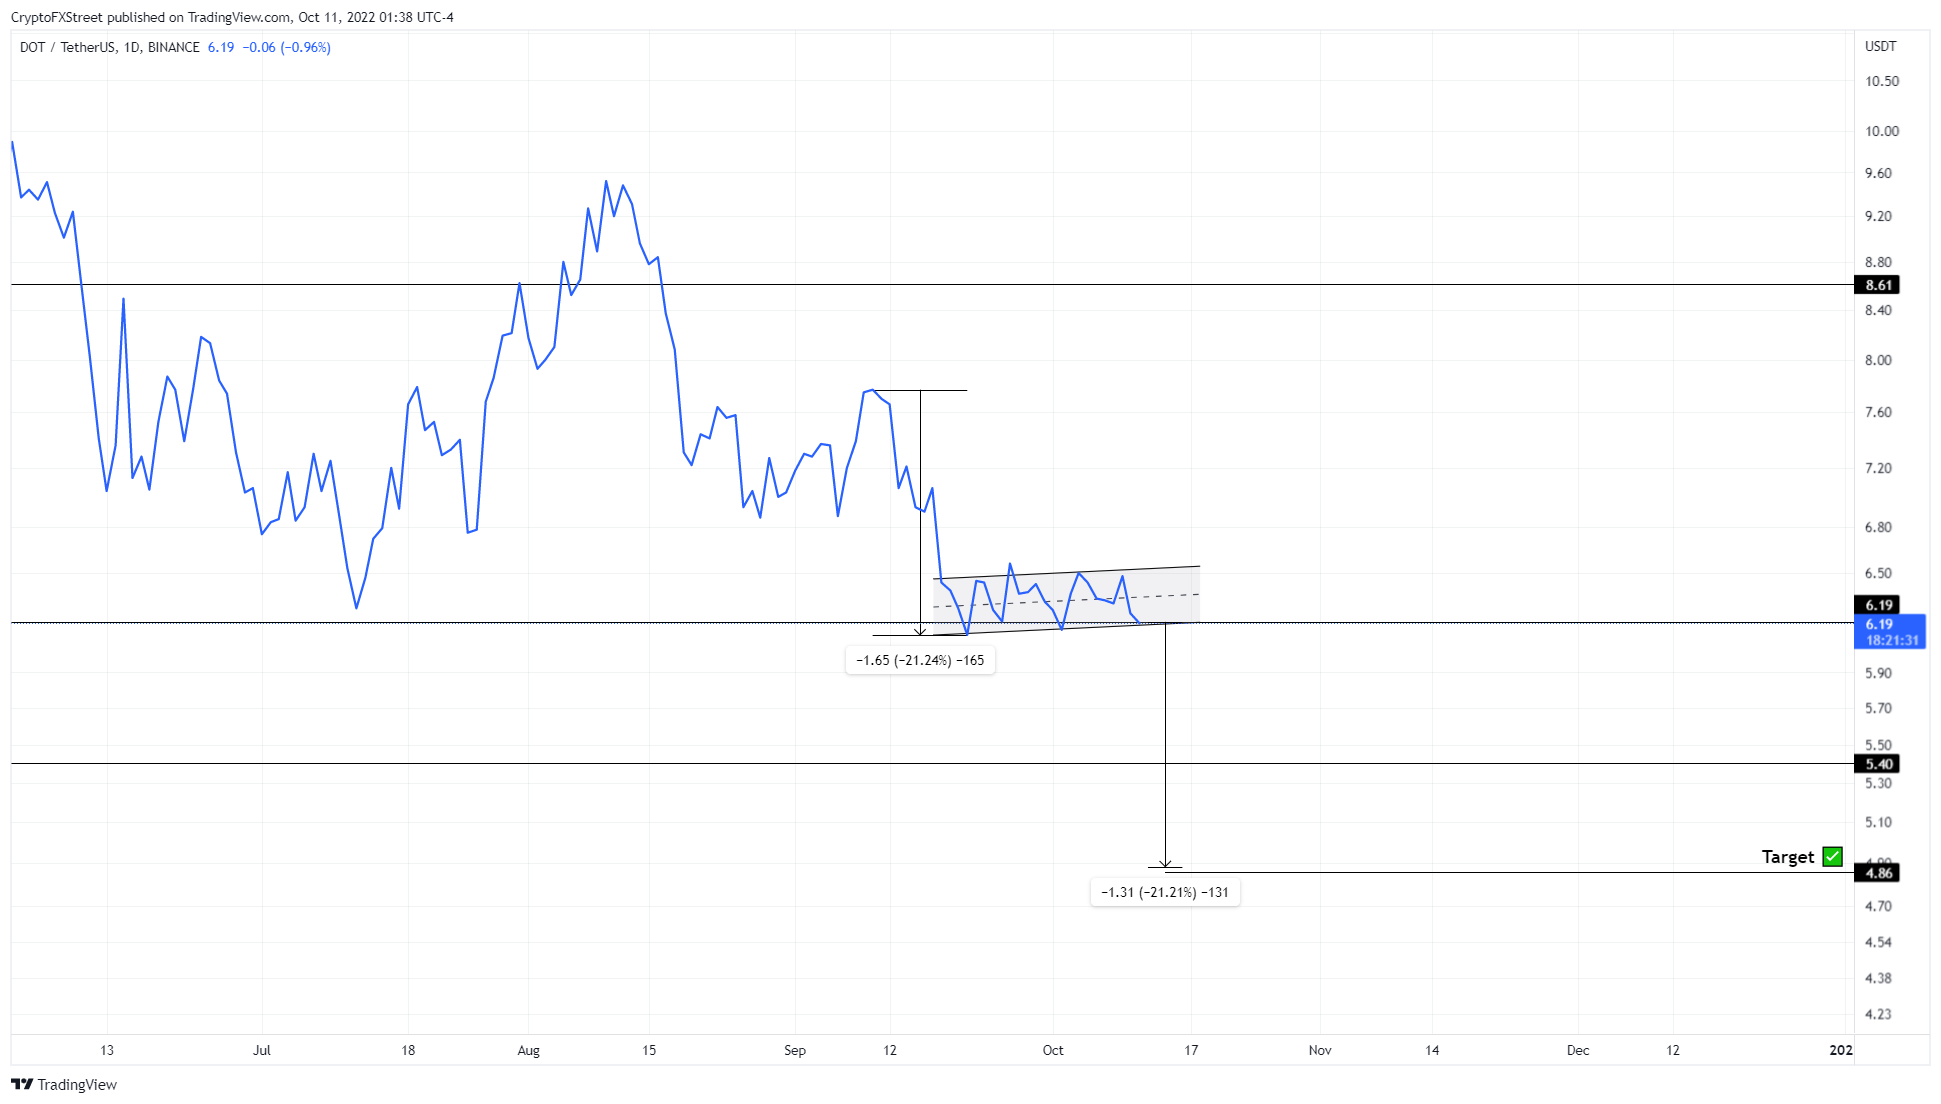
DOT/USDT 1-day chart
Regardless of the discernable bearishness on the charts, investors need to keep a close eye on Bitcoin price, which will dictate where Polkadot price will head next. Since BTC is also exuding a potentially bearish setup, market participants should exercise caution.
On the off chance, Bitcoin price triggers a reversal, market participants can expect most altcoins, including Polkadot price, to follow in its footsteps. In such a case, a daily candlestick close above $6.48 will create a higher high and invalidate the bearish theiss for DOT.
This move could develop into a rally if bulls make a strong comeback and maintain their momentum. Such a situation could see DOT retest the $6.86 resistance level.
Author

Akash Girimath
FXStreet
Akash Girimath is a Mechanical Engineer interested in the chaos of the financial markets. Trying to make sense of this convoluted yet fascinating space, he switched his engineering job to become a crypto reporter and analyst.


