- Polkadot price action is trading in abnormally tight ranges.
- DOT price action is long overdue a breakout as the squeezes are getting to the narrowest point ever.
- The longer this continues, the bigger the risk of a massive imbalance followed by a sharp move lower to $1.42.
Polkadot (DOT) price action looks almost reluctant to react to any market news or events and neither bulls nor bears are willing to enter massive orders. This stands in contrast to other cryptocurrencies that are very sensitive to the current elements moving markets, ranging from geopolitics to central banks and economic data releases. This insensitiveness could be pointing to a massive move on the horizon, however, as one side eventually gets the upper hand and drives the direction.
Is the DOT price set to implode?
Polkadot price action has been trading in a very narrow range with very limited upside and downside for over a month. This is reflected in the Historic Volatility bar below the graph, where it is visible that volatility has hit an all-time low. It almost looks like Polkadot price action is insensitive to any of the waves and shocks that have hit markets recently. This could point to a risk that buyers or sellers will soon exit their positions, creating an imbalance that will trigger a price correction.
DOT price is thus set to tank sharply or even implode should bulls decide to exit, especially given the current global economic backdrop. That would mean a massive cash departure, and the market cap for DOT price action cut in half. On the charts, that would be translated into a nosedive move toward either $3.00, with the three-monthly supportive pivots coming in to slow down the plunging elevator – or the historical low at $1.42 as the end of the line in this decline.
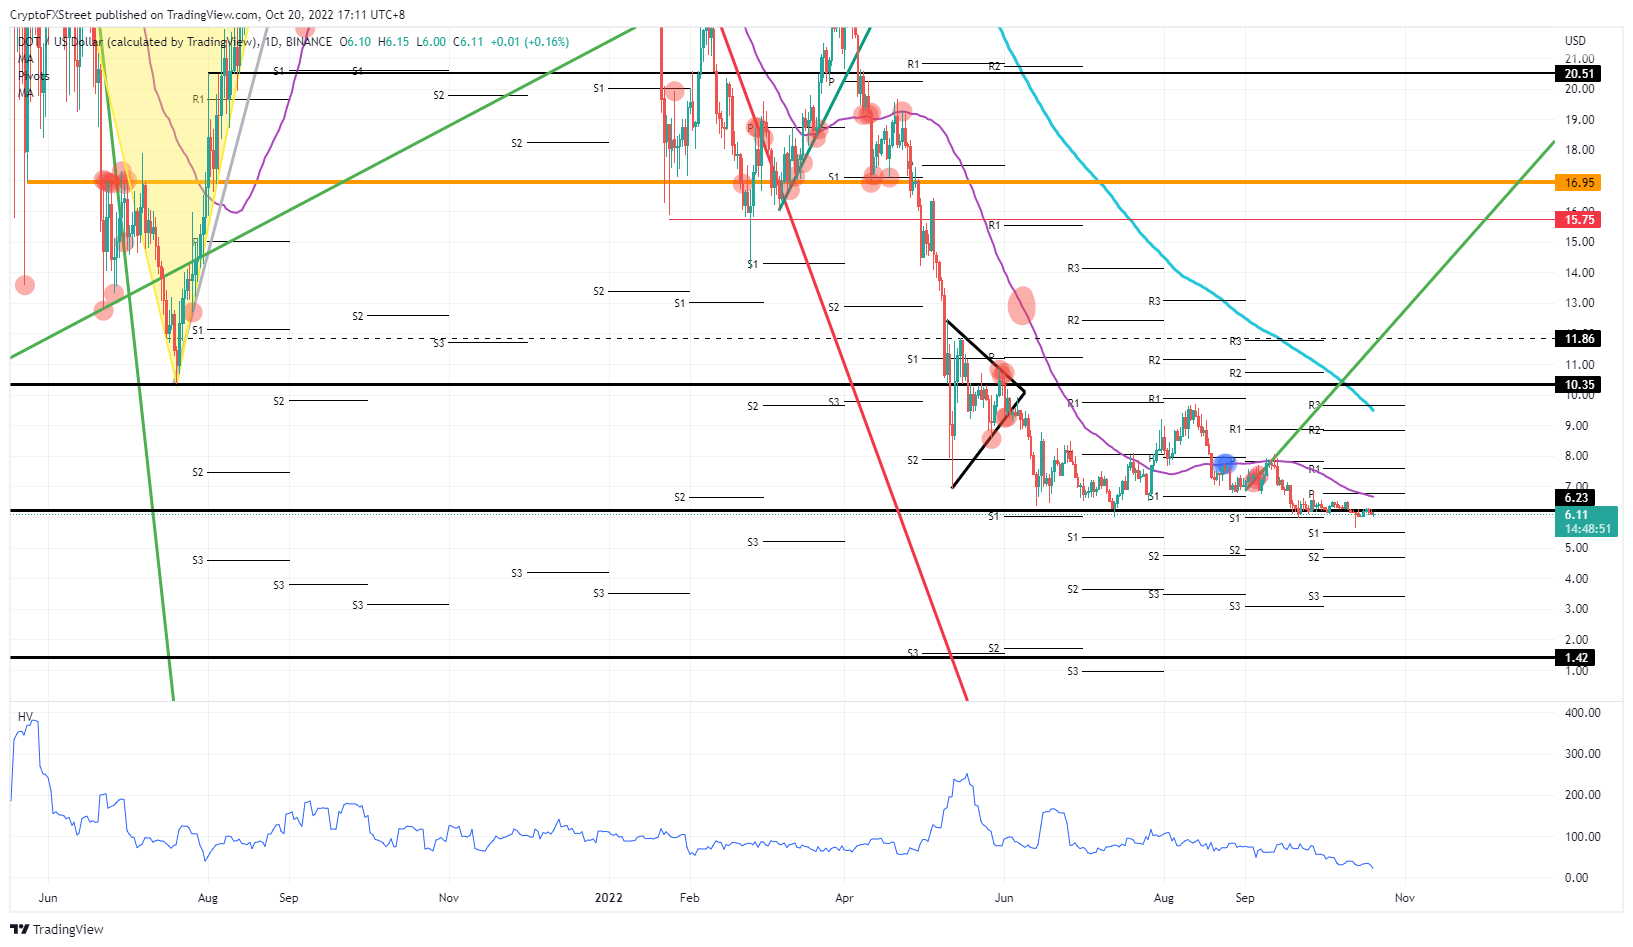
DOT/USD Daily chart
From a bullish perspective, the biggest reference to determine whether an uptick could be the beginning of a rally comes with a break above the 55-day Simple Moving Average near $7. Seeing its importance since August, it is the best barometer on when to enter long positions. Once the rally starts, expect it to stretch as far as $9.50 with the monthly R3 resistance and the 200-day SMA coming in as caps on the topside.
Information on these pages contains forward-looking statements that involve risks and uncertainties. Markets and instruments profiled on this page are for informational purposes only and should not in any way come across as a recommendation to buy or sell in these assets. You should do your own thorough research before making any investment decisions. FXStreet does not in any way guarantee that this information is free from mistakes, errors, or material misstatements. It also does not guarantee that this information is of a timely nature. Investing in Open Markets involves a great deal of risk, including the loss of all or a portion of your investment, as well as emotional distress. All risks, losses and costs associated with investing, including total loss of principal, are your responsibility. The views and opinions expressed in this article are those of the authors and do not necessarily reflect the official policy or position of FXStreet nor its advertisers. The author will not be held responsible for information that is found at the end of links posted on this page.
If not otherwise explicitly mentioned in the body of the article, at the time of writing, the author has no position in any stock mentioned in this article and no business relationship with any company mentioned. The author has not received compensation for writing this article, other than from FXStreet.
FXStreet and the author do not provide personalized recommendations. The author makes no representations as to the accuracy, completeness, or suitability of this information. FXStreet and the author will not be liable for any errors, omissions or any losses, injuries or damages arising from this information and its display or use. Errors and omissions excepted.
The author and FXStreet are not registered investment advisors and nothing in this article is intended to be investment advice.
Recommended Content
Editors’ Picks

Litecoin Price Prediction: LTC tries to retake $100 resistance as miners halt sell-off
Litecoin price grazed 105 mark on Monday, rebounding 22% from the one-month low of $87 recorded during last week’s market crash. On-chain data shows sell pressure among LTC miners has subsided. Is the bottom in?

Bitcoin fails to recover as Metaplanet buys the dip
Bitcoin price struggles around $95,000 after erasing gains from Friday’s relief rally over the weekend. Bitcoin’s weekly price chart posts the first major decline since President-elect Donald Trump’s win in November.

SEC Commissioner Hester Pierce sheds light on Ethereum ETF staking under new administration
In a Friday interview with Coinage, SEC Commissioner Hester Peirce discussed her optimism about upcoming regulatory changes as the agency transitions to new leadership under President Trump’s pick for new Chair, Paul Atkins.

Bitcoin dives 3% from its recent all-time high, is this the cycle top?
Bitcoin investors panicked after the Fed's hawkish rate cut decision, hitting the market with high selling pressure. Bitcoin's four-year market cycle pattern indicates that the recent correction could be temporary.
Bitcoin: 2025 outlook brightens on expectations of US pro-crypto policy
Bitcoin price has surged more than 140% in 2024, reaching the $100K milestone in early December. The rally was driven by the launch of Bitcoin Spot ETFs in January and the reduced supply following the fourth halving event in April.

Best Forex Brokers with Low Spreads
VERIFIED Low spreads are crucial for reducing trading costs. Explore top Forex brokers offering competitive spreads and high leverage. Compare options for EUR/USD, GBP/USD, USD/JPY, and Gold.