- Polkadot price has crashed 74% from its all-time high and is currently consolidating.
- A fractal for DOT hints that this coiling up will lead to an explosive move in the near future.
- A daily candlestick close below $15.85 will create a lower low and invalidate the bullish thesis.
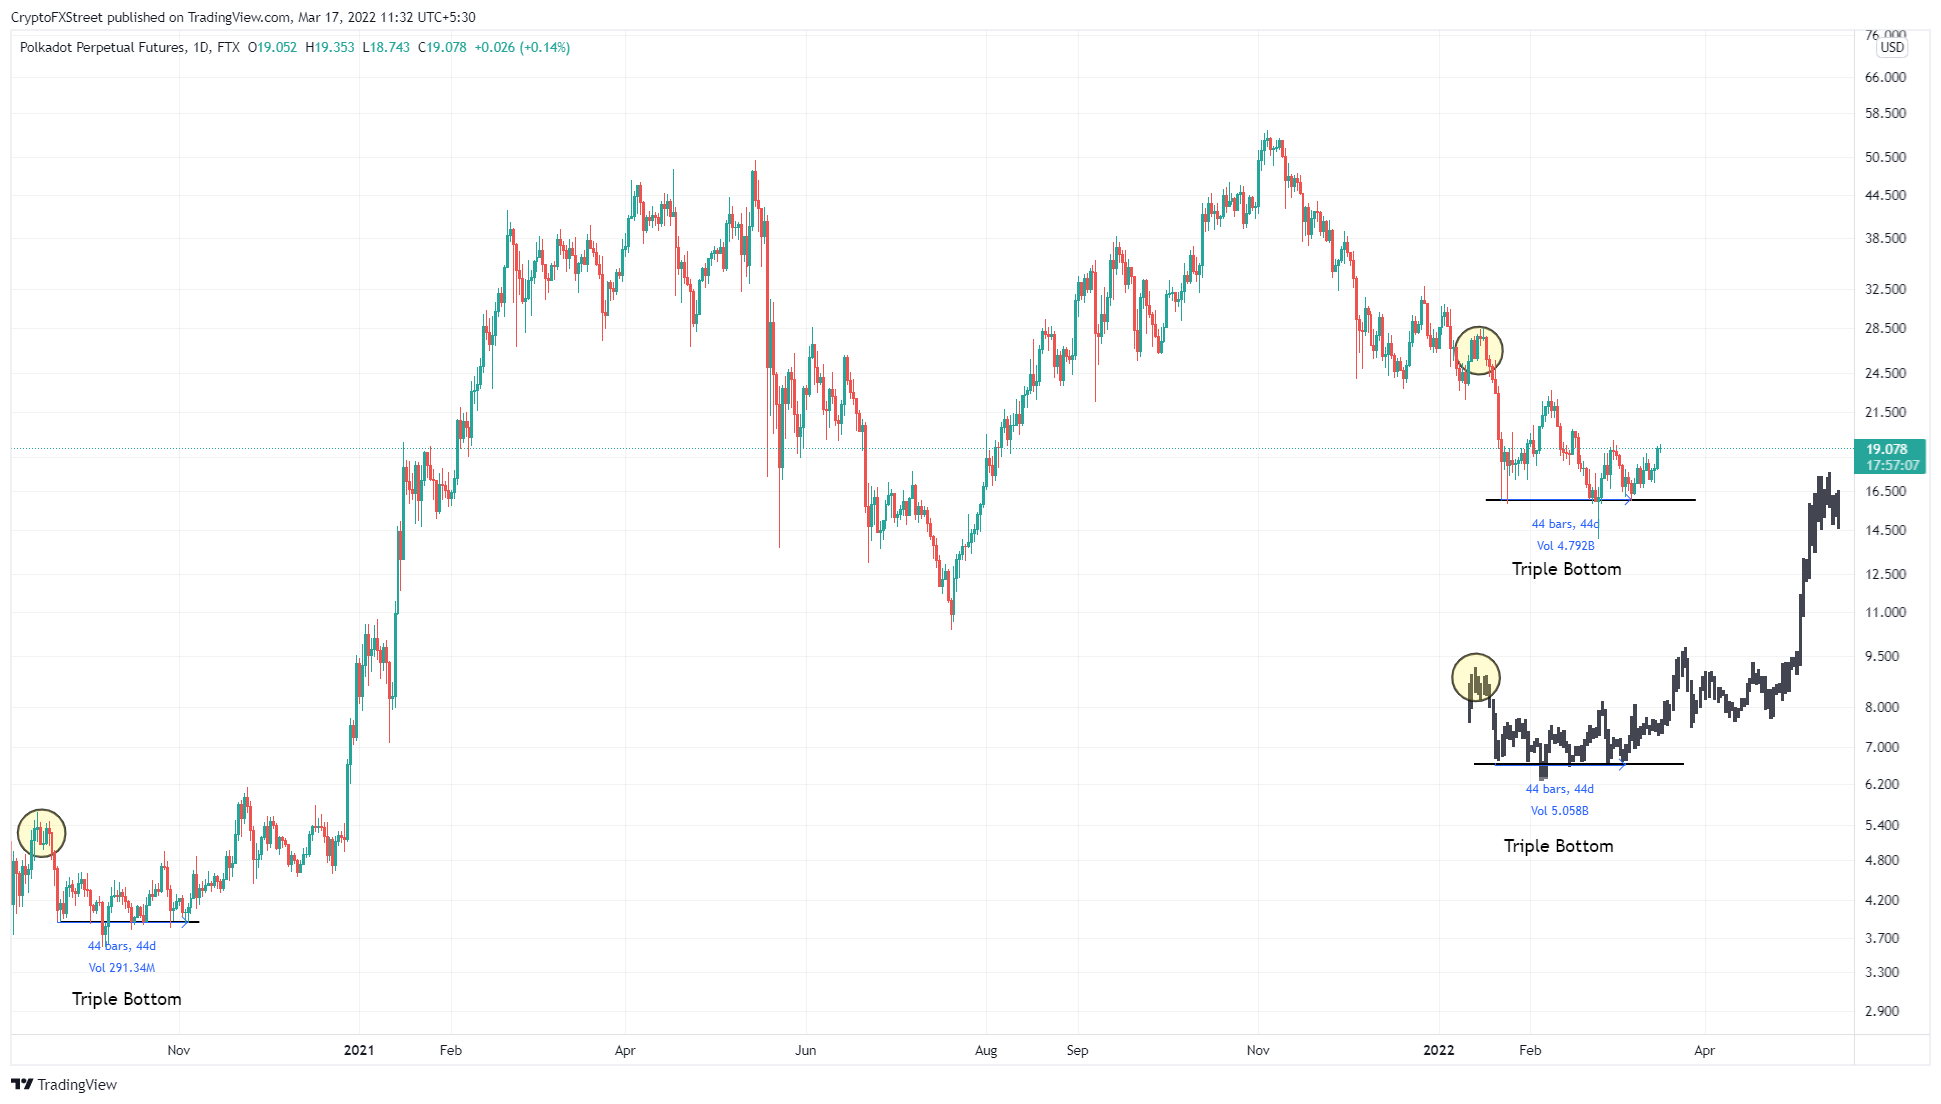
Polkadot price seems to be looking for a bottom after undergoing a massive devaluation over the past four months. Interestingly, this price action seems to have led to a fractal.
Polkadot price history to repeat
Polkadot price set up a triple bottom setup in late 2020. This technical formation usually contains a swing low formation followed by a deviation below this level and a third retest, often followed by a reversal of trend favoring the bulls.
Although Polkadot price consolidated quite a bit after the triple bottom formation, it caught traction after a tiny consolidation in late December 2020. In total, the reversal setup lasted 43 days and resulted in a total of 1000% upswing over the next four months.
Interestingly, Polkadot price has produced a similar triple bottom setup of the same duration as the one formed in 2020 and hints at a similar outcome. Assuming DOT bulls manage to pull off such a run-up, investors can long DOT at the current level and expect a 100% upswing in the coming months.
DOT/USDT 1-day chart
While the fractal is extremely bullish, Polkadot price needs to confirm it by following a similar path. Due to the high degree of uncertainty in traditional markets and the effects of interest rate hikes, however, there is a good chance this setup might turn sour.
A daily candlestick close below $15.85 will create a lower low and invalidate the bullish thesis for the Polkadot price. Such a move will open the path for bears to explore the 13.16 support level after crashing 17%.
Information on these pages contains forward-looking statements that involve risks and uncertainties. Markets and instruments profiled on this page are for informational purposes only and should not in any way come across as a recommendation to buy or sell in these assets. You should do your own thorough research before making any investment decisions. FXStreet does not in any way guarantee that this information is free from mistakes, errors, or material misstatements. It also does not guarantee that this information is of a timely nature. Investing in Open Markets involves a great deal of risk, including the loss of all or a portion of your investment, as well as emotional distress. All risks, losses and costs associated with investing, including total loss of principal, are your responsibility. The views and opinions expressed in this article are those of the authors and do not necessarily reflect the official policy or position of FXStreet nor its advertisers. The author will not be held responsible for information that is found at the end of links posted on this page.
If not otherwise explicitly mentioned in the body of the article, at the time of writing, the author has no position in any stock mentioned in this article and no business relationship with any company mentioned. The author has not received compensation for writing this article, other than from FXStreet.
FXStreet and the author do not provide personalized recommendations. The author makes no representations as to the accuracy, completeness, or suitability of this information. FXStreet and the author will not be liable for any errors, omissions or any losses, injuries or damages arising from this information and its display or use. Errors and omissions excepted.
The author and FXStreet are not registered investment advisors and nothing in this article is intended to be investment advice.
Recommended Content
Editors’ Picks

Grayscale files S-3 form for Digital Large Cap ETF comprising Bitcoin, Ethereum, XRP, Solana, and Cardano
Grayscale, a leading digital asset manager operating the GBTC ETF, has filed the S-3 form with the United States (US) Securities and Exchange Commission (SEC) in favor of a Digital Large Cap ETF.

Top 3 Price Prediction Bitcoin, Ethereum, Ripple: BTC, ETH, and XRP brace for volatility amid Trump’s ‘Liberation Day’
Bitcoin price faces a slight rejection around its $85,000 resistance level on Wednesday after recovering 3.16% the previous day. Ripple follows BTC as it falls below its critical level, indicating weakness and a correction on the horizon.

Top crypto news: VanEck hints at BNB ETF, Circle files S-1 application for IPO
Asset manager VanEck registered a BNB Trust in Delaware on Tuesday, marking its intention to register for an ETF product with the Securities & Exchange Commission (SEC).

Solana Price Forecast for April 2025: SOL traders risk $120 reversal as FTX begins $800M repayments on May 30
Solana price consolidated below $130 on Tuesday, facing mounting headwinds in April as investors grow wary of looming FTX sell-offs.

Bitcoin: BTC remains calm before a storm
Bitcoin's price has been consolidating between $85,000 and $88,000 this week. A K33 report explains how the markets are relatively calm and shaping up for volatility as traders absorb the tariff announcements. PlanB’s S2F model shows that Bitcoin looks extremely undervalued compared to Gold and the housing market.

The Best brokers to trade EUR/USD
SPONSORED Discover the top brokers for trading EUR/USD in 2025. Our list features brokers with competitive spreads, fast execution, and powerful platforms. Whether you're a beginner or an expert, find the right partner to navigate the dynamic Forex market.