- Polkadot upswing from the support at $26 has hit a barrier at $38.
- The ongoing correction occurs in the wake of the TD Sequential sell signal on the 12-hour chart.
- The SuperTrend indicator recently presented a buy signal, likely to invalidate the downswing.
Polkadot is battling with rising overhead pressure following a rejection at $38. Before the recent upswing, the token had dropped significantly from the all-time high of $42. Support established at $26 allowed bulls the opportunity to push DOT above $30. Meanwhile, massive declines are likely to come into the picture unless higher support is embraced.
Polkadot bows under rising overhead pressure
The TD Sequential indicator has recently flashed a sell signal in the form of a green nine candlestick on the 12-hour chart. The call to sell identifies positions where the bullish momentum is losing strength. This implies that the bears are increasing their positions. As overhead pressure surges, a correction comes into play. If the sell signal is validated, Polkadot may fall in one to four 12-hour candlesticks.
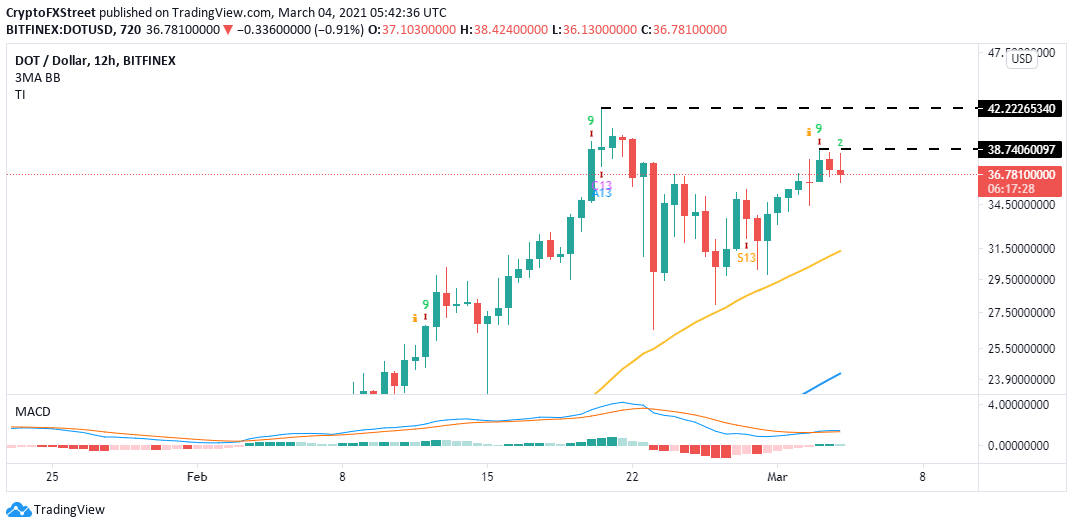
DOT/USD 12-hour chart
Support must be secured, preferably at the 50 Simple Moving Average on the 12-hour chart. Otherwise, Polkadot could freefall back to the support at $26. If push comes to shove and the bearish leg stretches further, the 100 SMA will come in handy.
Looking at the other side of the picture
The 4-hour chart brings to light the long signal by the SuperTrend indicator. Traders are signified to buy when this technical pattern turns from red to green while moving below the asset’s price. As long as the SuperTrend indicator remains bullish, Polkadot’s downside will be protected.
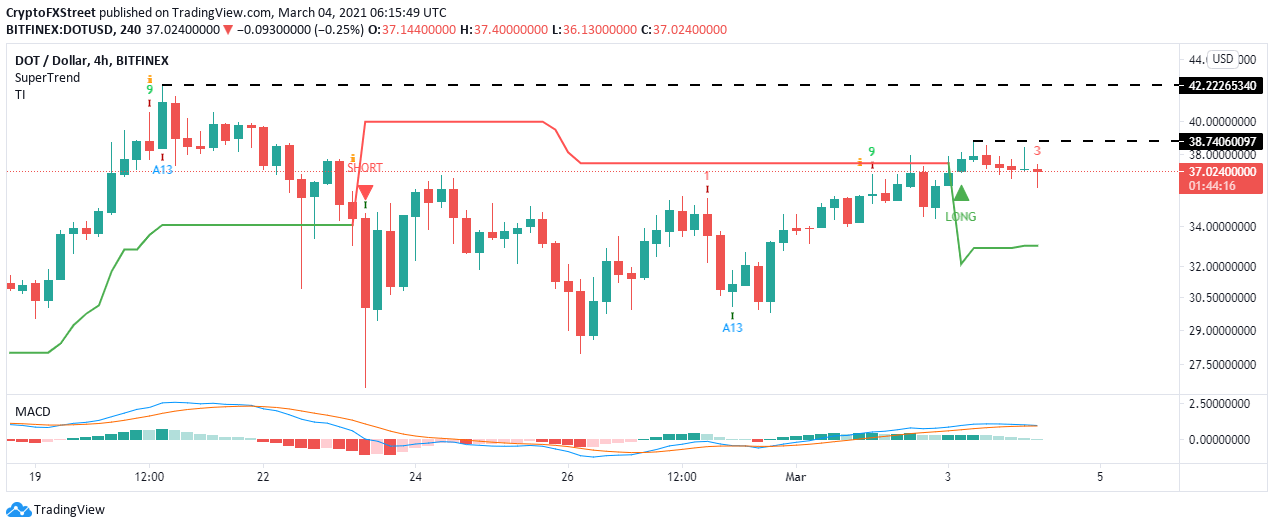
DOT/USD-hour chart
It is worth mentioning that the moving Average Convergence Divergence (MACD) has a bullish impulse, thus validating the SuperTrend. However, the MACD has to stay above the midline to avoid crossing below the signal line for the bullish narrative to hold.
Information on these pages contains forward-looking statements that involve risks and uncertainties. Markets and instruments profiled on this page are for informational purposes only and should not in any way come across as a recommendation to buy or sell in these assets. You should do your own thorough research before making any investment decisions. FXStreet does not in any way guarantee that this information is free from mistakes, errors, or material misstatements. It also does not guarantee that this information is of a timely nature. Investing in Open Markets involves a great deal of risk, including the loss of all or a portion of your investment, as well as emotional distress. All risks, losses and costs associated with investing, including total loss of principal, are your responsibility. The views and opinions expressed in this article are those of the authors and do not necessarily reflect the official policy or position of FXStreet nor its advertisers. The author will not be held responsible for information that is found at the end of links posted on this page.
If not otherwise explicitly mentioned in the body of the article, at the time of writing, the author has no position in any stock mentioned in this article and no business relationship with any company mentioned. The author has not received compensation for writing this article, other than from FXStreet.
FXStreet and the author do not provide personalized recommendations. The author makes no representations as to the accuracy, completeness, or suitability of this information. FXStreet and the author will not be liable for any errors, omissions or any losses, injuries or damages arising from this information and its display or use. Errors and omissions excepted.
The author and FXStreet are not registered investment advisors and nothing in this article is intended to be investment advice.
Recommended Content
Editors’ Picks

Dogecoin and Bitcoin Cash Price Prediction: Funding rates decrease indicate weakness in DOGE and BCH
Dogecoin and Bitcoin Cash registered 3% and 8% losses on Tuesday following increased selling pressure from the futures market. The decline comes amid large-cap cryptos like Bitcoin, Ether and XRP, holding still with slight gains.

XRP could sustain rally amid growing ETF and SEC vote prospects
Ripple flaunted a bullish outlook, trading at $2.1505 on Tuesday. Investor risk appetite has continued to grow since the middle of last week, propping XRP for a sustainable upward move triggered by the swift decision by US President Donald Trump to suspend reciprocal tariffs for 90 days.

VeChain Price Forecast: VET bulls aim for a double-digit rally
VeChain price hovers around $0.023 on Tuesday after breaking above a falling wedge pattern the previous day; a breakout of this pattern favors the bulls. Bybit announced on Monday that VET would be listed on its exchange. Moreover, the technical outlook suggests rallying ahead, targeting double-digit gains.
Dogecoin, Shiba Inu and Fartcoin price prediction if Bitcoin crosses $100K this week
The meme coin market fell sharply on Monday, shedding 4.8% in market capitalization to settle at $49.25 billion, according to data compiled from CoinGecko. The sell-off coincided with increased volatility across broader crypto markets while investors rotated funds into Bitcoin briefly tested $85,000.

Bitcoin Weekly Forecast: Market uncertainty lingers, Trump’s 90-day tariff pause sparks modest recovery
Bitcoin (BTC) price extends recovery to around $82,500 on Friday after dumping to a new year-to-date low of $74,508 to start the week. Market uncertainty remains high, leading to a massive shakeout, with total liquidations hitting $2.18 billion across crypto markets.

The Best brokers to trade EUR/USD
SPONSORED Discover the top brokers for trading EUR/USD in 2025. Our list features brokers with competitive spreads, fast execution, and powerful platforms. Whether you're a beginner or an expert, find the right partner to navigate the dynamic Forex market.