Polkadot Price Forecast: DOT makes new all-time highs while technicals spell trouble
- Polkadot price is at risk of a major correction as a key indicator presented a sell signal.
- There isn’t a lot of support on the way down for DOT.
- Nonetheless, the digital asset still aims for higher highs in the long-term.

Polkadot has once again established a new all-time high at $31.06 this time. The digital asset has exploded by almost 600% since December 23, 2020, reaching a massive market capitalization of $27 billion, close to Tether, which is currently ranked 3rd.
Polkadot price will most likely see a correction before another leg up
On the daily chart, the TD Sequential indicator has just presented a sell signal right at the top. Polkadot price is poised for a healthy correction after a significant rally in the past two months.
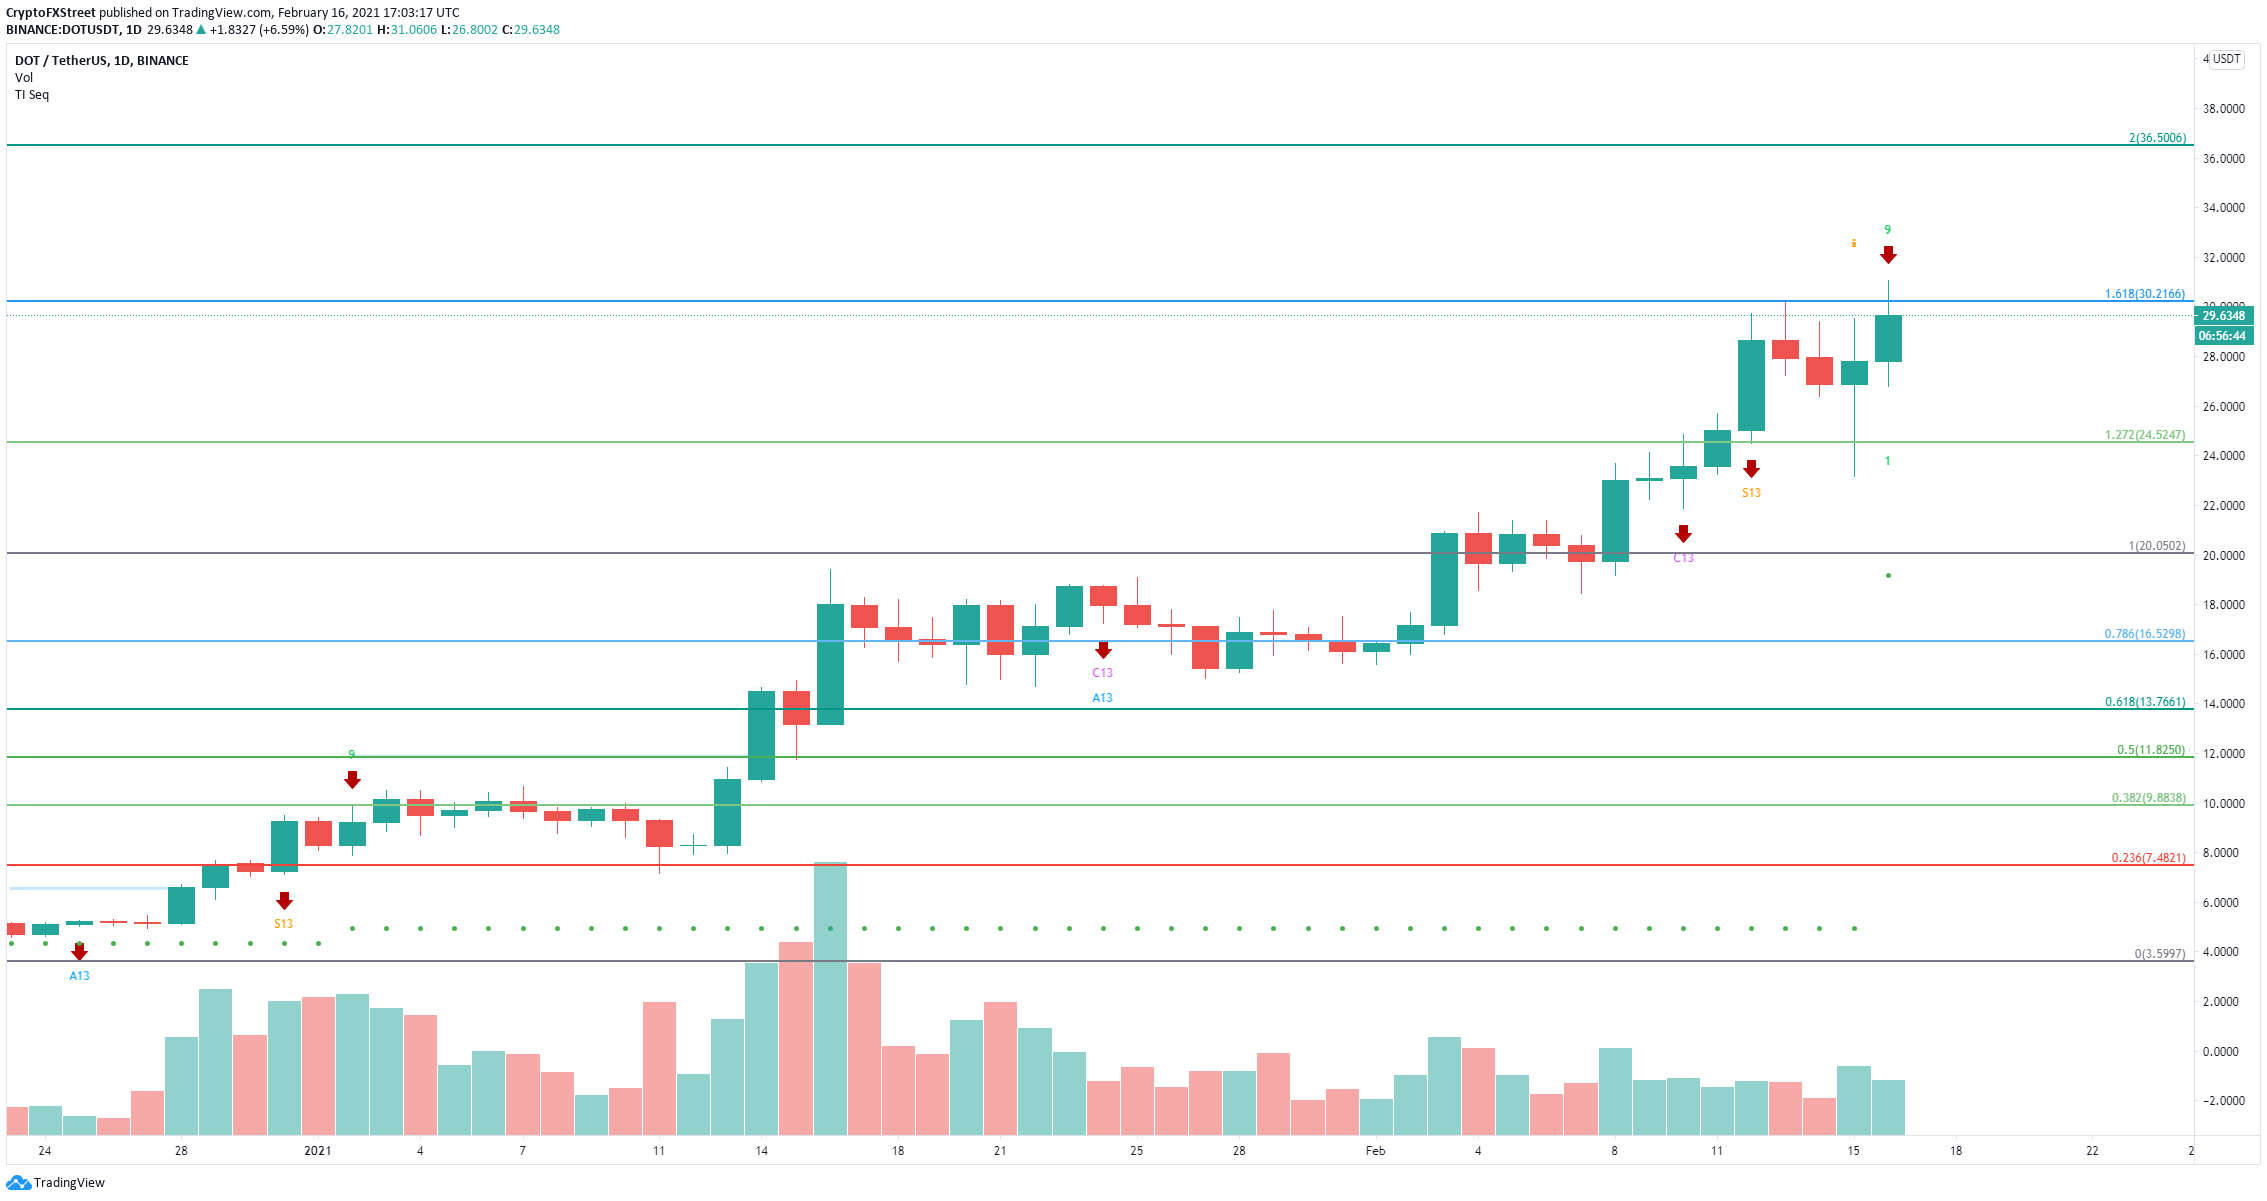
DOT/USD daily chart
The nearest support level is around $24.5, which is the 127.2% Fibonacci level after Polkadot price topped out at the 161.8% point. DOT can slide as low as $20 if bears pick up enough momentum.
To invalidate the bearish outlook, DOT bulls will have to establish a daily candlestick close above the recent high at $31.06. The next potential price target for Polkadot is $36.5 which is the 200% Fib level on the way up.
Author

Lorenzo Stroe
Independent Analyst
Lorenzo is an experienced Technical Analyst and Content Writer who has been working in the cryptocurrency industry since 2012. He also has a passion for trading.


