![]() Sheldon McIntyre, CMT
Sheldon McIntyre, CMT
Independent Analyst
- Polkadot price has climbed 87% over the last 21 sessions, lifting the August return to 21.48%.
- DOT claimed the strategically important 50-week simple moving average (SMA), currently at $18.40.
- Daily Relative Strength Index (RSI) reached an overbought reading for the first time since the early-April high.
Polkadot price has delivered solid gains for investors, marching 87% while recording three consecutive positive weeks and a 21.48% gain for August. The impulsive rally has struck stiff resistance at a price range of $18.39 to $20.80, formed by lows printed in late May and in the first half of June. The overbought condition, stiff resistance and potential for a head-and-shoulders top on the daily RSI suggests some caution at the current DOT price levels.
Polkadot price confirms the rise of altcoins again
Polkadot price has engineered an impressive rally, and it has been supported by a surge in volume, with several days closing well above the 50-day average. The DOT rebound has also been reinforced by intra-day milestones, including a bullish Golden Cross pattern on the six-hour chart.
The momentum generated by the Polkadot price rally activated a bullish Golden Cross pattern on the six-hour chart on August 4, when the 50 six-hour SMA crossed above the 200 six-hour SMA. The last Golden Cross that accompanied a major DOT bottom was the beginning of November 2020, before the steep rally of over 40% later in the month.
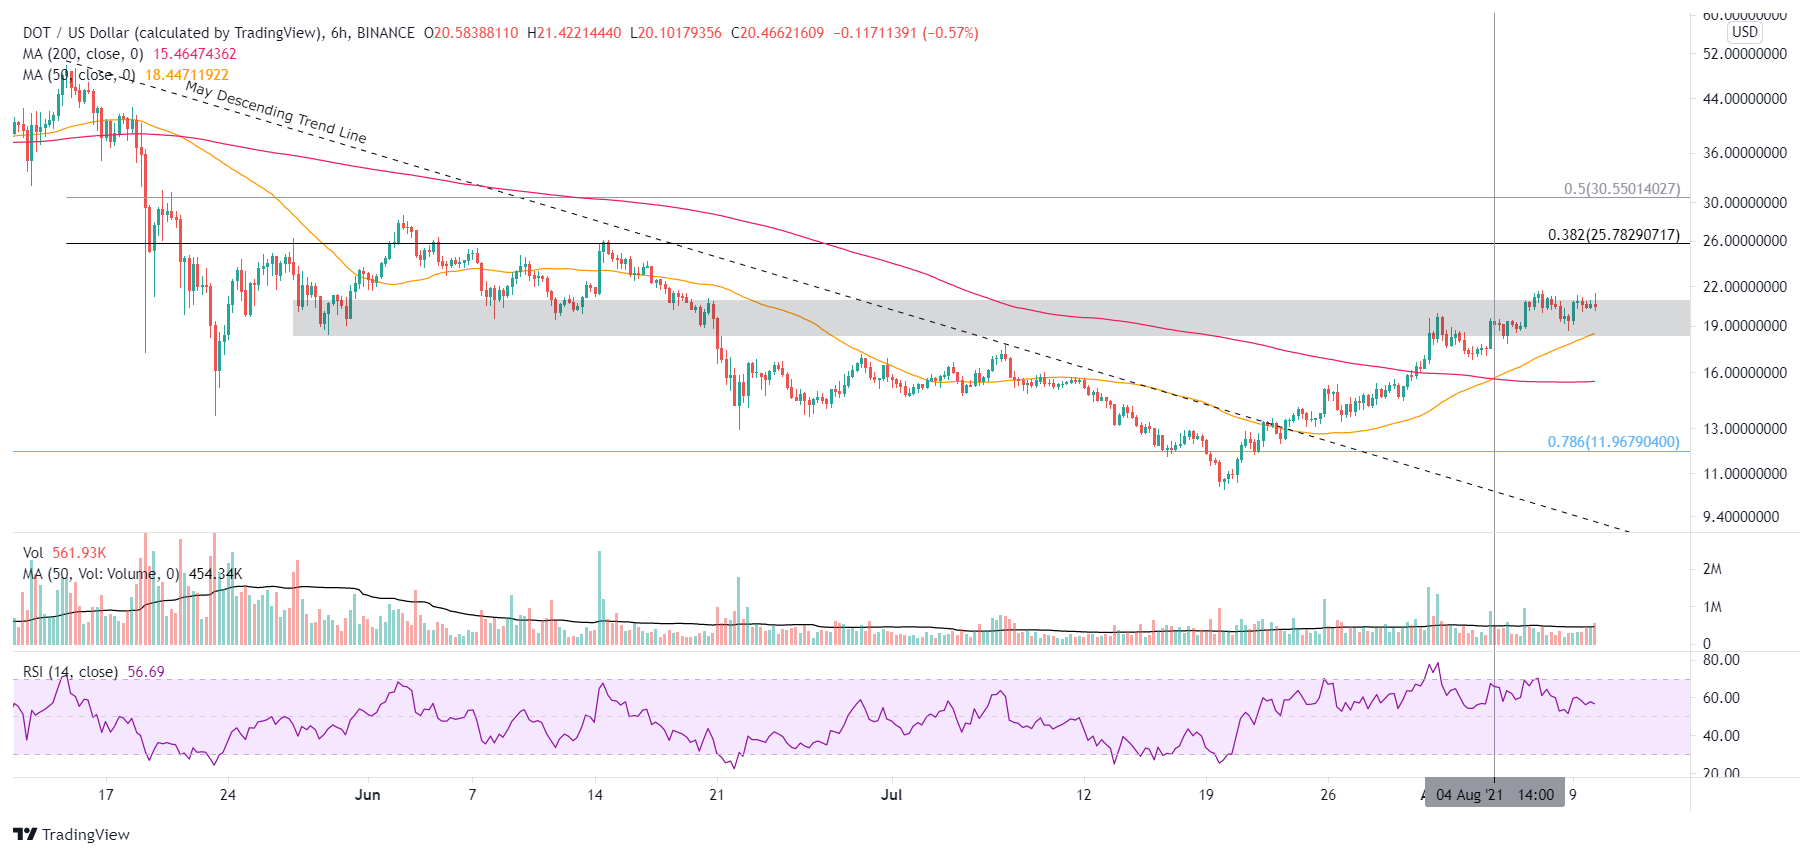
DOT/USD 6-hour chart
The explosive Polkadot price rally has reached a concerning deviation from the 50-day SMA in the short term. The 31% deviation indicates that DOT may be primed to retrace some of the recent gains to release price congestion. However, the correction could also occur over time and not price.
A second reason for some form of corrective process is the limited Polkadot price progress after it rallied into the price range of $18.39 to $20.80 on August 1. DOT has only managed to gain another 7% from the August 1 high of $20.50 to the August 7 high of $21.95. Moreover, the altcoin has closed five of the previous six sessions inside the range and is set to do so again today.
Ideally, the downside should be limited to the low of the range at $18.39 or the July 7 high of $17.88. Additional DOT weakness will not find support until the 50-day SMA at $15.55, leaving Polkadot price to confront the resistance associated with the price range again.
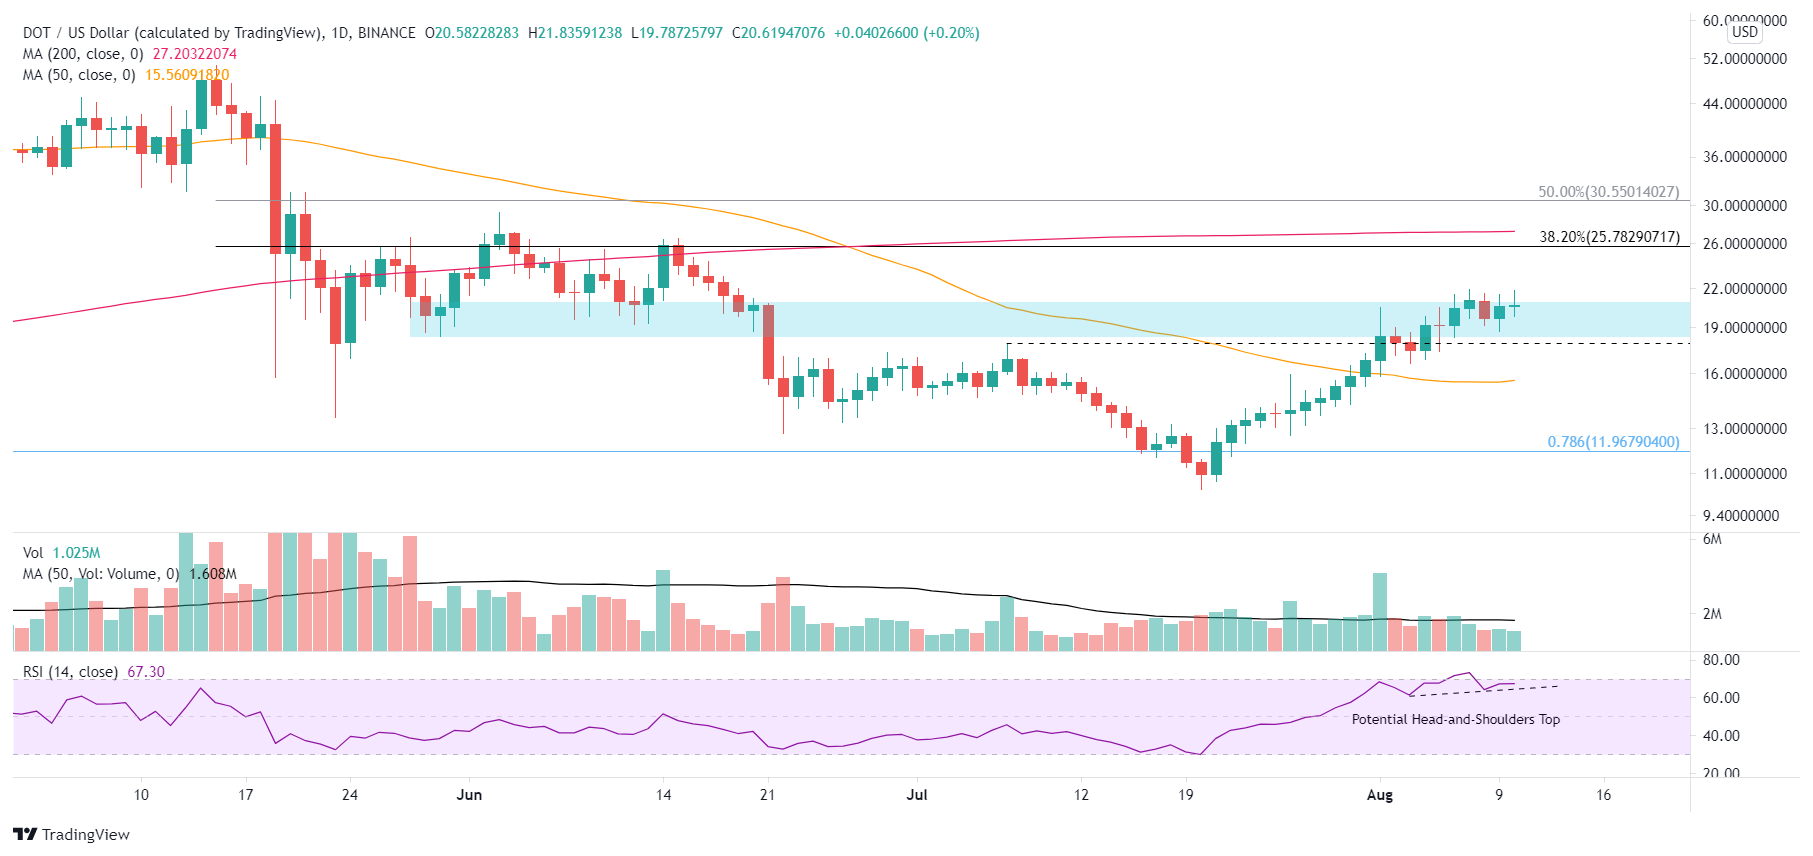
DOT/USD daily chart
Suppose the DOT consolidation over the last eight days is the limit of the correction. In that case, it should not discover resistance until the 38.2% Fibonacci retracement of the entire correction at $25.78 and then the 200-day SMA at $27.20, representing a 32% gain from the current Polkadot price.
The catalysts are in place for a DOT correction, an overbought reading on the daily RSI, a credible resistance price range, and a notable deviation from the 50-day SMA. Nevertheless, the 87% gain over the last 21 sessions is one of the confirmations that altcoins have re-established a presence in the cryptocurrency complex, and Polkadot price should still tag higher prices in the weeks ahead.
Note: All information on this page is subject to change. The use of this website constitutes acceptance of our user agreement. Please read our privacy policy and legal disclaimer. Opinions expressed at FXstreet.com are those of the individual authors and do not necessarily represent the opinion of FXstreet.com or its management. Risk Disclosure: Trading foreign exchange on margin carries a high level of risk, and may not be suitable for all investors. The high degree of leverage can work against you as well as for you. Before deciding to invest in foreign exchange you should carefully consider your investment objectives, level of experience, and risk appetite. The possibility exists that you could sustain a loss of some or all of your initial investment and therefore you should not invest money that you cannot afford to lose. You should be aware of all the risks associated with foreign exchange trading, and seek advice from an independent financial advisor if you have any doubts.
Recommended Content
Editors’ Picks

Litecoin Price Prediction: LTC tries to retake $100 resistance as miners halt sell-off
Litecoin price grazed 105 mark on Monday, rebounding 22% from the one-month low of $87 recorded during last week’s market crash. On-chain data shows sell pressure among LTC miners has subsided. Is the bottom in?

Bitcoin fails to recover as Metaplanet buys the dip
Bitcoin price struggles around $95,000 after erasing gains from Friday’s relief rally over the weekend. Bitcoin’s weekly price chart posts the first major decline since President-elect Donald Trump’s win in November.

SEC Commissioner Hester Pierce sheds light on Ethereum ETF staking under new administration
In a Friday interview with Coinage, SEC Commissioner Hester Peirce discussed her optimism about upcoming regulatory changes as the agency transitions to new leadership under President Trump’s pick for new Chair, Paul Atkins.

Bitcoin dives 3% from its recent all-time high, is this the cycle top?
Bitcoin investors panicked after the Fed's hawkish rate cut decision, hitting the market with high selling pressure. Bitcoin's four-year market cycle pattern indicates that the recent correction could be temporary.
Bitcoin: 2025 outlook brightens on expectations of US pro-crypto policy
Bitcoin price has surged more than 140% in 2024, reaching the $100K milestone in early December. The rally was driven by the launch of Bitcoin Spot ETFs in January and the reduced supply following the fourth halving event in April.

Best Forex Brokers with Low Spreads
VERIFIED Low spreads are crucial for reducing trading costs. Explore top Forex brokers offering competitive spreads and high leverage. Compare options for EUR/USD, GBP/USD, USD/JPY, and Gold.