• Polkadot price action is getting squeezed in from both sides. 
  • Buyers have the upper hand as a few technical resistances have been broken.
  • The first price target is 22% up. After that, another 18% of profit is just around the corner.

Polkadot (DOT) is on the verge of jumping higher as buyers attack, breaking a few resistances to the upside. Price is getting squeezed in and is ready for the break out toward the next profit level higher at $45.22.

Polkadot price is ready for the pop higher with 22% profit in sight

Polkadot price price action is hovering around $37.03 and $37.41 – two important resistance levels that sellers have defended heavily the past few weeks. The first resistance, $37.03, was the low on May 18. The day after, DOT broke below that level and has not been back up since this week. It holds a certain value and will act as resistance for now. Add to that the monthly R1 resistance level at $37.41, and you get a double top resistance zone where buyers will step up to the plate in order to get it broken.

Proof of that fight going on is to be found in the price reaction and behaviour of Polkadot. Monday, DOT averaged a 20% move between the high and low price of the day. Tuesday, it only averaged 13% of a range between the high and low of the day. Today, Wednesday, DOT is only at 6%. Price is consolidating and ready for the break higher as buyers and sellers are getting pulled toward each other. 
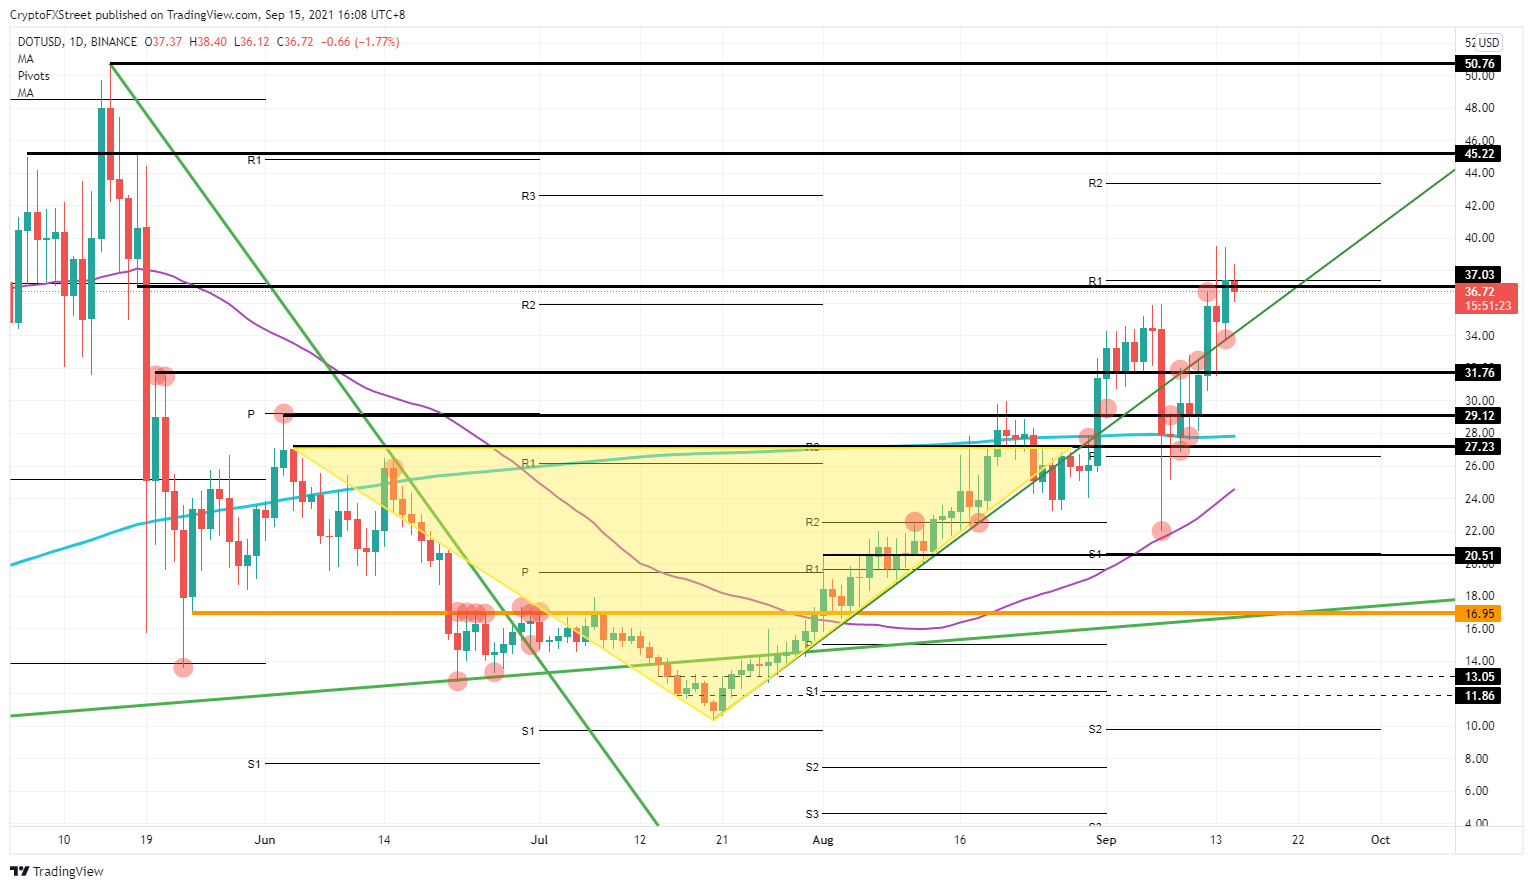
DOT/USD daily chart

DOT/USD daily chart

Polkadot has buyers written all over its price action in the elements that the green ascending trend line is again a force to reckon with. On Tuesday, the low of the session bounced exactly off that green ascending trend line. The week before, that ascending trend line got tested three times but failed each time to break to the upside. As price action in DOT is elevated, buyers have no other option than to push price action above $37.

It will be critical to see if buyers can close above today. If that succeeds, expect a rally toward $45.22, a double top since May 6. Once from there, it is not far toward $50. The psychological element is essential, but it was the daily high from May 15 as well. Hence, those are two reasons for buyers to do a retest. 

Should sellers take over price action, expect a retest first of the green ascending trend line followed by a push back to $31.76.


Information on these pages contains forward-looking statements that involve risks and uncertainties. Markets and instruments profiled on this page are for informational purposes only and should not in any way come across as a recommendation to buy or sell in these assets. You should do your own thorough research before making any investment decisions. FXStreet does not in any way guarantee that this information is free from mistakes, errors, or material misstatements. It also does not guarantee that this information is of a timely nature. Investing in Open Markets involves a great deal of risk, including the loss of all or a portion of your investment, as well as emotional distress. All risks, losses and costs associated with investing, including total loss of principal, are your responsibility. The views and opinions expressed in this article are those of the authors and do not necessarily reflect the official policy or position of FXStreet nor its advertisers. The author will not be held responsible for information that is found at the end of links posted on this page.

If not otherwise explicitly mentioned in the body of the article, at the time of writing, the author has no position in any stock mentioned in this article and no business relationship with any company mentioned. The author has not received compensation for writing this article, other than from FXStreet.

FXStreet and the author do not provide personalized recommendations. The author makes no representations as to the accuracy, completeness, or suitability of this information. FXStreet and the author will not be liable for any errors, omissions or any losses, injuries or damages arising from this information and its display or use. Errors and omissions excepted.

The author and FXStreet are not registered investment advisors and nothing in this article is intended to be investment advice.

Join Telegram

Recommended content


Recommended Content

Editors’ Picks

Celebrity meme coins controversy continues amid Pump.fun revenue dominance

Celebrity meme coins controversy continues amid Pump.fun revenue dominance

Pump.fun outperformed the Ethereum blockchain on Tuesday after raking in $1.99 million. Following this achievement, a meme coin based on actress Sydney Sweeney was the subject of controversy after its developers dumped their bags on investors.

More Meme Coins News

PEPE's on-chain metrics indicate potential rally after weeks of silence

PEPE's on-chain metrics indicate potential rally after weeks of silence

PEPE has struggled to see any significant price move after reaching an all-time high in May. Increased adoption rate and low MVRV ratio indicate a bullish run may be on the horizon. A single PEPE outflow from Binance worth $14.7 million gives credence to signs of bullish expectation.

More Pepe News

Ethereum has failed to overcome key resistance despite bullish sentiment surrounding ETH ETF

Ethereum has failed to overcome key resistance despite bullish sentiment surrounding ETH ETF

Ethereum (ETH) is down more than 1.4% on Tuesday following another ETH sale from the Ethereum Foundation. Meanwhile, crypto exchange Gemini's recent report reveals that ETH ETF could see about $5 billion in net inflows within six months of launch.

More Ethereum News

Crypto community blasts Polkadot following report of treasury spending

Crypto community blasts Polkadot following report of treasury spending

Polkadot reports $87 million of treasury spending during H1. Crypto community members expressed harsh feelings toward the DOT team's high spending. DOT is up more than 2% in the past 24 hours but risks correction following the report.

More Polkadot News

Bitcoin: BTC price correction could end in July, according to seasonal data

Bitcoin: BTC price correction could end in July, according to seasonal data

Bitcoin (BTC) price appears poised for a decline this week, influenced by slight outflows in US spot ETFs, selling activity among BTC miners, and a combined transfer of 4,690.28 BTC to centralized exchanges by the US and German governments.

Read full analysis

BTC

ETH

XRP