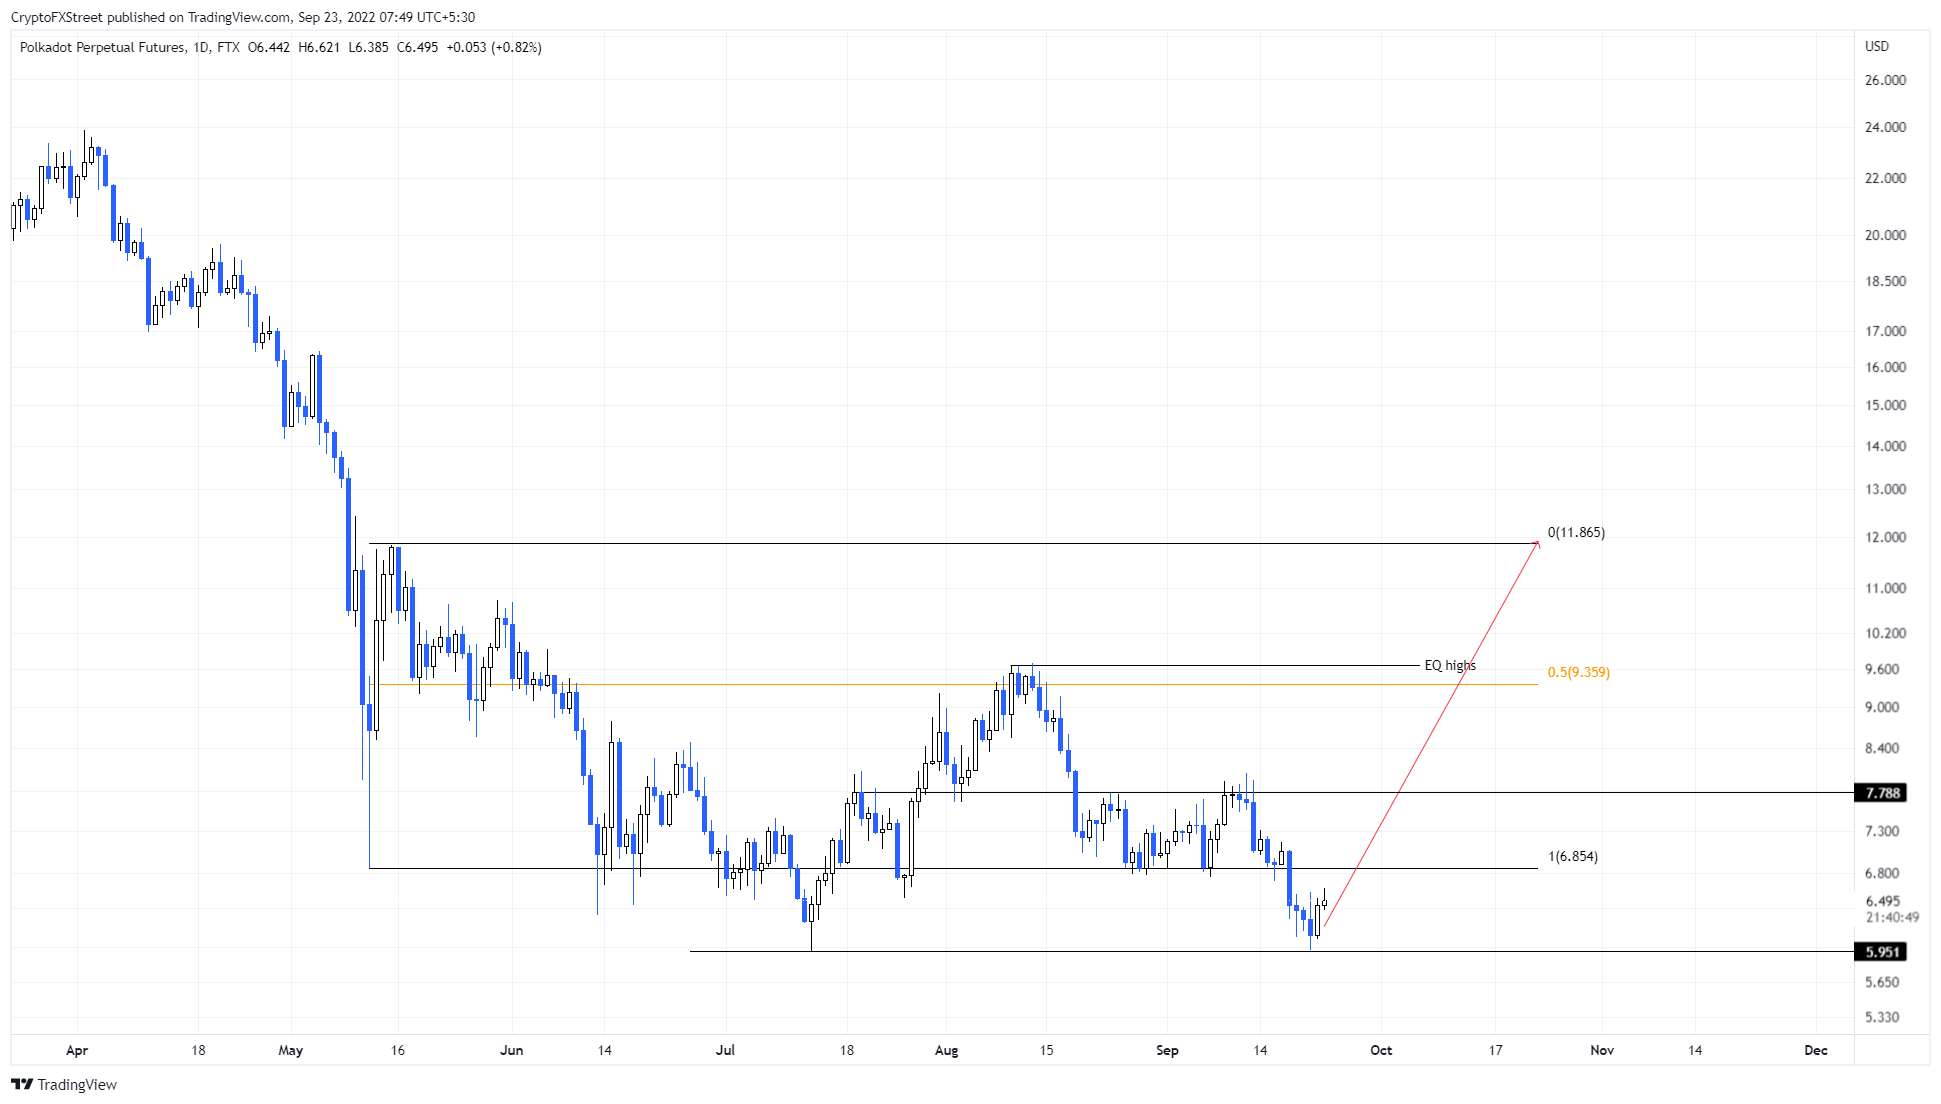
• Polkadot price shows double bottom formation at $5.95, suggesting a bottom reversal setup.
  • Investors can expect DOT to reach the $7.78 hurdle and higher levels if it can overcome the $6.85 blockade. 
  • A daily candlestick close below $5.95 will invalidate the bullish thesis.

Polkadot price hints at a bottom reversal pattern that could trigger a run-up soon. However, this outlook is far from being confirmed as DOT needs to overcome plenty of hurdles to kick-start its run-up.

Polkadot price is ready to struggle

Polkadot price crashed 38% between August 10 and September 21, which resulted in a swing low at $5.95. This development makes it the second swing low to form at the same level, indicating a double bottom.

This technical formation is a bottom reversal pattern and forecasts a shift in trend favoring the bulls. However, Polkadot price will need to reclaim the $6.85 to $11.86 range and stay in there. Once this short-term target is achieved, investors can expect DOT to move to the $7.78 hurdle, denoting a 20% run-up from the current position.

Even after this move, Polkadot price needs to overcome the $7.78 resistance level to confirm the shift in trend favoring bulls. This move will allow DOT to retest the aforementioned range’s midpoint at $9.35 and potentially extend this rally to $11.86.

DOT/USDT 1-day chart

DOT/USDT 1-day chart

On the other hand, if Polkadot price fails to recover above the range low at $6.85, it will indicate a lack of buying pressure. If sellers take over, investors can expect DOT to slide lower.

If Polkadot price produces a daily candlestick close below $5.95, it will create a lower low and invalidate the double bottom’s bullish potential. This development could see DOT  crash to $5.5. 

Note:

The video attached below talks about Bitcoin price and its potential outlook, which could influence Polkadot price.


Information on these pages contains forward-looking statements that involve risks and uncertainties. Markets and instruments profiled on this page are for informational purposes only and should not in any way come across as a recommendation to buy or sell in these assets. You should do your own thorough research before making any investment decisions. FXStreet does not in any way guarantee that this information is free from mistakes, errors, or material misstatements. It also does not guarantee that this information is of a timely nature. Investing in Open Markets involves a great deal of risk, including the loss of all or a portion of your investment, as well as emotional distress. All risks, losses and costs associated with investing, including total loss of principal, are your responsibility. The views and opinions expressed in this article are those of the authors and do not necessarily reflect the official policy or position of FXStreet nor its advertisers. The author will not be held responsible for information that is found at the end of links posted on this page.

If not otherwise explicitly mentioned in the body of the article, at the time of writing, the author has no position in any stock mentioned in this article and no business relationship with any company mentioned. The author has not received compensation for writing this article, other than from FXStreet.

FXStreet and the author do not provide personalized recommendations. The author makes no representations as to the accuracy, completeness, or suitability of this information. FXStreet and the author will not be liable for any errors, omissions or any losses, injuries or damages arising from this information and its display or use. Errors and omissions excepted.

The author and FXStreet are not registered investment advisors and nothing in this article is intended to be investment advice.

Join Telegram

Recommended content


Recommended Content

Editors’ Picks

Ripple on-chain metrics show bullish signs amidst legal struggle with SEC, XRP eyes recovery

Ripple on-chain metrics show bullish signs amidst legal struggle with SEC, XRP eyes recovery

Ripple made a comeback above $0.48 on Tuesday and hovers above that level in Wednesday’s European session. Ripple on-chain metrics such as transaction volume and Network Realized Profit/Loss have turned bullish, supporting a recovery in the altcoin. 

More Ripple News

Bitcoin price falls amidst German government transfers, miners activity

Bitcoin price falls amidst German government transfers, miners activity

Bitcoin (BTC) extends correction on Wednesday and hovers around $61,000 after finding resistance near the $64,000 level on Monday. Recent on-chain data indicates heightened selling activity from Bitcoin miners early in the week. 

More Bitcoin News

Crypto Today: Bitcoin erases gains from end of June, Ethereum declines while Ripple holds

Crypto Today: Bitcoin erases gains from end of June, Ethereum declines while Ripple holds

Bitcoin wipes out gains from the last week of June and falls below $60,000 on Wednesday. Ethereum and top altcoins ranked by market capitalization erased gains as the inflation outlook worsened. Ripple holds on to recent gains and hovers above $0.48 on Wednesday. 

More Cryptocurrencies News

Three reasons why altcoins could shake off losses this week

Three reasons why altcoins could shake off losses this week

On-chain data from Santiment shows that altcoins are currently in the opportunity zone, or generating buy signals. The top three altcoins in the buy zone are Basic Attention Token (BAT), Chromia (CHR), and Highstreet (HIGH), per Santiment. 

More Altcoins News

Bitcoin: BTC price correction could end in July, according to seasonal data

Bitcoin: BTC price correction could end in July, according to seasonal data

Bitcoin (BTC) price appears poised for a decline this week, influenced by slight outflows in US spot ETFs, selling activity among BTC miners, and a combined transfer of 4,690.28 BTC to centralized exchanges by the US and German governments.

Read full analysis

BTC

ETH

XRP