Polkadot price eyes retest of $30 after DOT breaks out of a three-week hurdle
- Polkadot price is hovering just above the 70.5% retracement level at $23.56.
- The recent breakout from a declining trend line suggests DOT could retest $30.
- A daily candlestick close below $22.50 will invalidate the bullish thesis.

Polkadot price is trading above crucial reversal zones on a higher time frame, indicating diminishing downward pressure. On a lower time frame, however, DOT has recently breached a crucial resistance barrier, revealing its intentions to move higher.
Polkadot price eyes a higher high
Polkadot price was stuck trading below a bear trend line since November 30. Multiple attempts to breach this trend line failed until December 20, where DOT produced a four-hour candlestick close above it.
This development was followed by a quick 4% run-up to where Polkadot price currently trades - $25.16. Investors need to note that there is a chance DOT could slide lower and retest the 70.5% retracement level at $23.56. In some cases, the altcoin could slide lower to collect the liquidity resting below $22.50.
However, a reversal at either of these levels should be expected. A surge in buying pressure will propel DOT to the immediate barrier at $27.36, denoting a 9% ascent from the current position. However, the short-term bullishness is likely to see a ceiling at $30, representing an 18% gain.
In a highly bullish case, the Polkadot price could extend to the 50% retracement level at $32.73 to fill the fair value gap present below it.
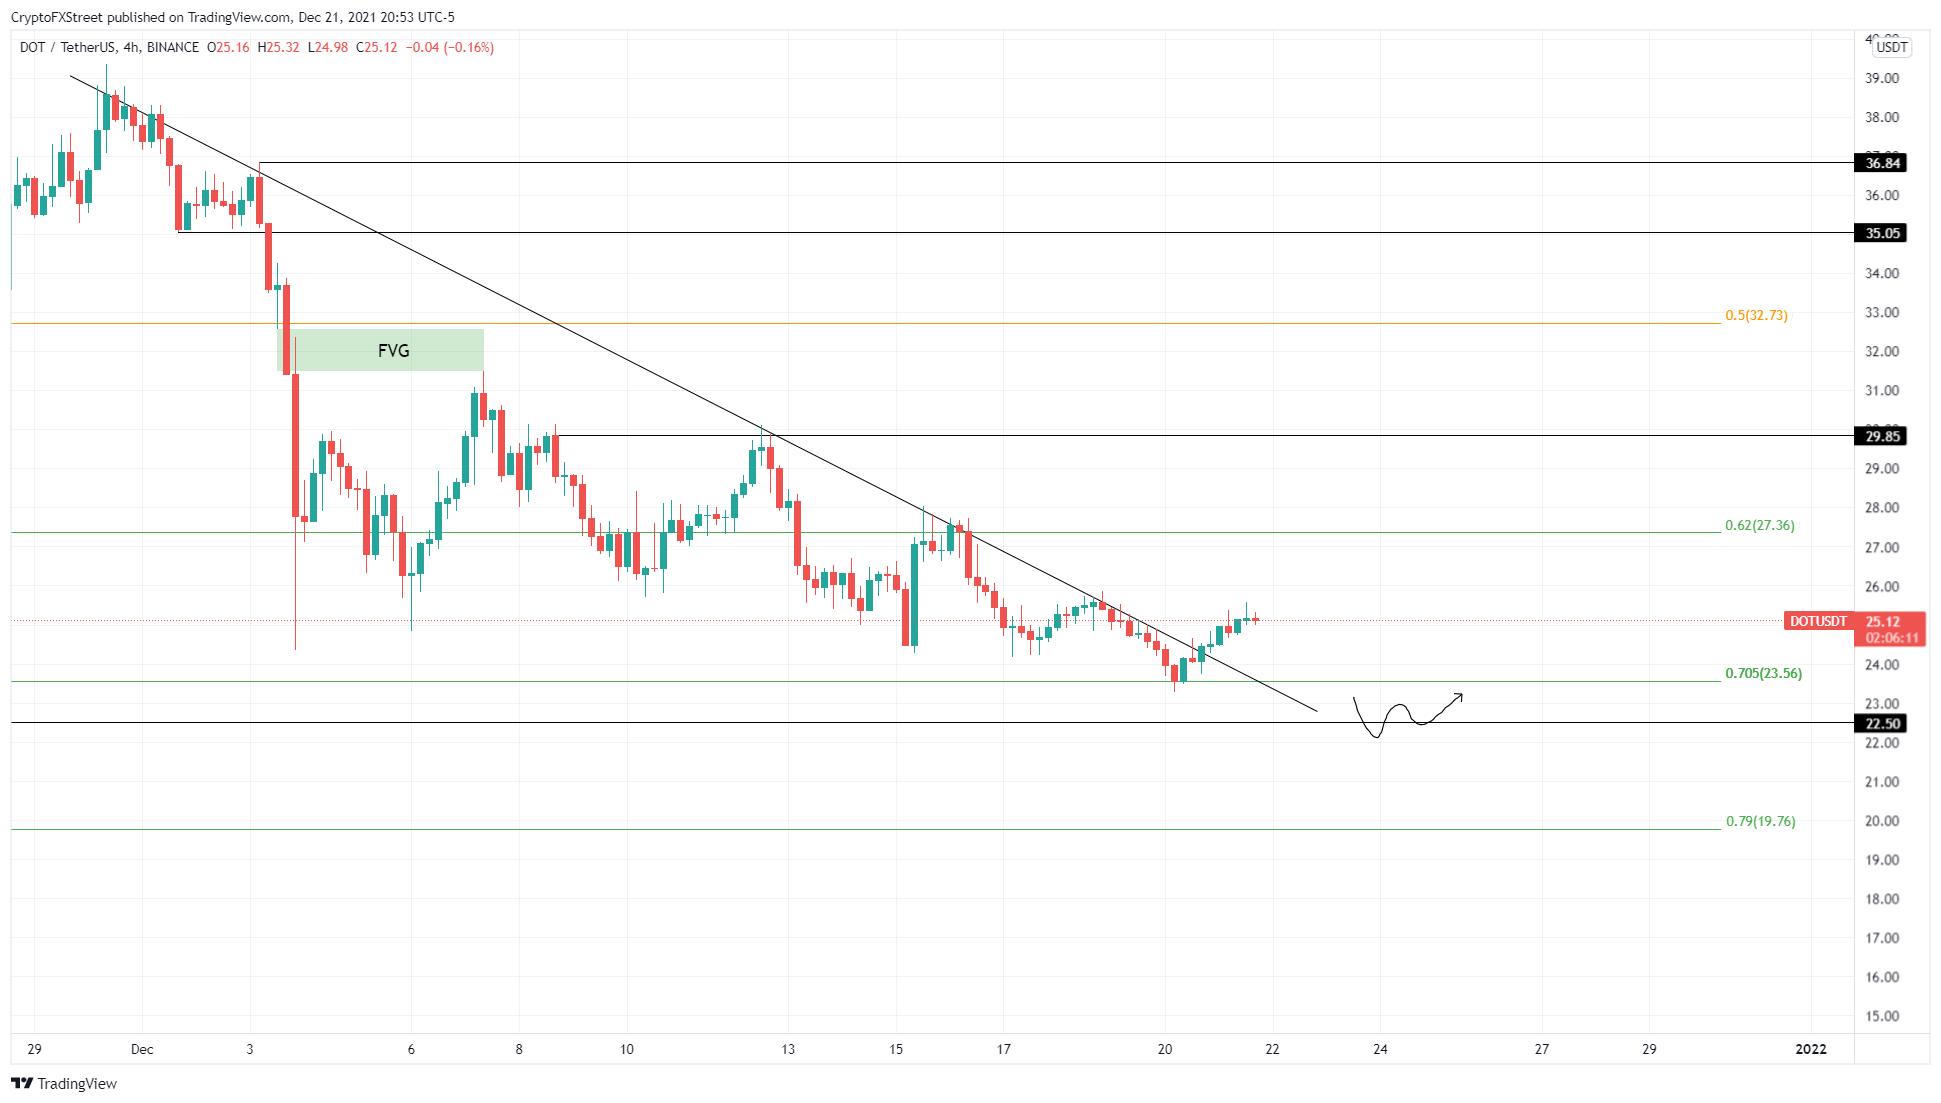
DOT/USDT 4-hour chart
On the other hand, if the Polkadot price fails to hold above the $22.50 support level and produces a daily close below it, the bullish thesis will face invalidation. In this case, DOT will crawl down to retest the 79% retracement level at $19.76, where buyers will have another go at an upswing.
Author

Akash Girimath
FXStreet
Akash Girimath is a Mechanical Engineer interested in the chaos of the financial markets. Trying to make sense of this convoluted yet fascinating space, he switched his engineering job to become a crypto reporter and analyst.


