- Polkadot price rebounds in a rising channel with short-term support at $6.80.
- The bullish outlook in DOT price is supported by a buy signal from the Super Trend indicator.
- Day traders throw their support behind a possible DOT price recovery to $10.00 as volume jumps 12% to $355 million.
Polkadot price is printing a bearish candlestick after bulls bowed to overhead pressure at $7.15. Despite this retracement, DOT’s value is up 20% from its most recent major support, marginally below $5.80.
Over the last 24 hours, trading volume across exchanges hit $355 million, representing a 12% spike. This shows that bulls are ready to defend Polkadot price from bearish advances mainly caused by early profit booking. If the immediate support at $6.80 holds, DOT could quickly stretch its leg to $10.00.
Polkadot price reaffirms $10-bound bullish move
Polkadot price holds within a rising channel that it has sustained for slightly over two weeks. The channel’s middle throughline prevented the intraday retracement from wiping out most of the gains accrued over the last two weeks.
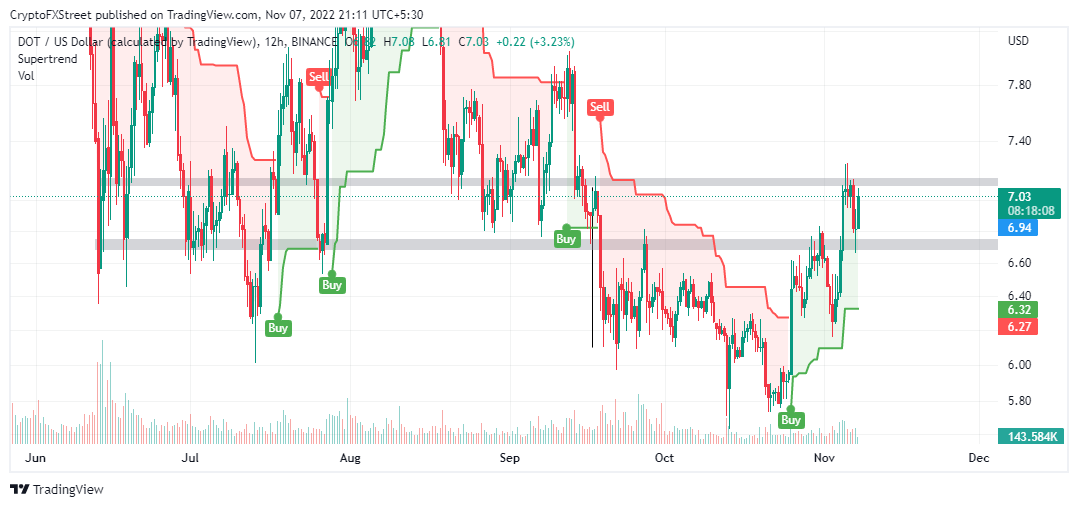
DOT now dodders at $7.05 as bulls focus on printing a bullish 12-hour to a daily chart candlestick above the rising channel’s middle line support at $6.80. Traders must be aware of the potential resistance at $7.15, currently giving buyers sleepless nights.
Therefore, it is necessary to wait until Polkadot price makes a clean break above the hurdle before triggering buy orders for profit booking at $7.50, $8.00 and $10.00 levels, respectively.

DOTUSD 12-hour chart
The Super Trend indicator in the same 12-hour time frame adds credence to the bullish outlook after sending a buy signal. As the indicator overlays the chart like a moving average, it utilizes the average true range (ATR) in its calculations to gauge market volatility.
DOTUSD 12-hour chart
Traders can use this indicator to confirm the strength of a prevailing trend. For instance, the buy signal in the case of Polkadot shows that bulls have the upper hand, and the price is likely to keep trending north.
On the other hand, short-term sell positions may turn profitable immediately if DOT fails to close the day above support at $6.80. Traders shorting Polkadot will look for exit points at $6.40, $6.00 and $5.80, respectively.
Information on these pages contains forward-looking statements that involve risks and uncertainties. Markets and instruments profiled on this page are for informational purposes only and should not in any way come across as a recommendation to buy or sell in these assets. You should do your own thorough research before making any investment decisions. FXStreet does not in any way guarantee that this information is free from mistakes, errors, or material misstatements. It also does not guarantee that this information is of a timely nature. Investing in Open Markets involves a great deal of risk, including the loss of all or a portion of your investment, as well as emotional distress. All risks, losses and costs associated with investing, including total loss of principal, are your responsibility. The views and opinions expressed in this article are those of the authors and do not necessarily reflect the official policy or position of FXStreet nor its advertisers. The author will not be held responsible for information that is found at the end of links posted on this page.
If not otherwise explicitly mentioned in the body of the article, at the time of writing, the author has no position in any stock mentioned in this article and no business relationship with any company mentioned. The author has not received compensation for writing this article, other than from FXStreet.
FXStreet and the author do not provide personalized recommendations. The author makes no representations as to the accuracy, completeness, or suitability of this information. FXStreet and the author will not be liable for any errors, omissions or any losses, injuries or damages arising from this information and its display or use. Errors and omissions excepted.
The author and FXStreet are not registered investment advisors and nothing in this article is intended to be investment advice.
Recommended Content
Editors’ Picks

Litecoin Price Prediction: LTC tries to retake $100 resistance as miners halt sell-off
Litecoin price grazed 105 mark on Monday, rebounding 22% from the one-month low of $87 recorded during last week’s market crash. On-chain data shows sell pressure among LTC miners has subsided. Is the bottom in?

Bitcoin fails to recover as Metaplanet buys the dip
Bitcoin price struggles around $95,000 after erasing gains from Friday’s relief rally over the weekend. Bitcoin’s weekly price chart posts the first major decline since President-elect Donald Trump’s win in November.

SEC Commissioner Hester Pierce sheds light on Ethereum ETF staking under new administration
In a Friday interview with Coinage, SEC Commissioner Hester Peirce discussed her optimism about upcoming regulatory changes as the agency transitions to new leadership under President Trump’s pick for new Chair, Paul Atkins.

Bitcoin dives 3% from its recent all-time high, is this the cycle top?
Bitcoin investors panicked after the Fed's hawkish rate cut decision, hitting the market with high selling pressure. Bitcoin's four-year market cycle pattern indicates that the recent correction could be temporary.
Bitcoin: 2025 outlook brightens on expectations of US pro-crypto policy
Bitcoin price has surged more than 140% in 2024, reaching the $100K milestone in early December. The rally was driven by the launch of Bitcoin Spot ETFs in January and the reduced supply following the fourth halving event in April.

Best Forex Brokers with Low Spreads
VERIFIED Low spreads are crucial for reducing trading costs. Explore top Forex brokers offering competitive spreads and high leverage. Compare options for EUR/USD, GBP/USD, USD/JPY, and Gold.