Polkadot price edges closer to 30% breakout as DOT range tightens
- Polkadot price coils up between the 50-day SMA and the three-day demand zone, extending from $10.36 to $15.65.
- A breakout is likely to result in a 30% move to $22.23, coinciding with the 100-day SMA.
- A decisive three-day candlestick close below the $10.36 level will invalidate the bullish thesis for DOT.

Polkadot price has faced a constant barrage of hurdles that have prevented it from heading higher in the past few weeks. The downswing is currently consolidating above the three-day demand zone, and the said huddle, suggests a breakout on the horizon.
Polkadot price at make or breakout moment
Polkadot price has crashed 74% since its all-time high in November 2021 to retest the $10.36 to $15.65 demand zone. The second retest has pushed DOT higher by 24% to where it currently trades - $17.49.
The 50-day Simple Moving Average (SMA) has remained a single and constant source of selling pressure, limiting the uptrend. So far, DOT faced roughly five rejections at the hand of the 50-day SMA.
The most recent rejections have pushed Polkadot price to consolidate between the said SMA and the three-day demand zone. Therefore, a breakout from this range will lead to gains for holders.
Due to Bitcoin’s position, investors can expect Polkadot price and altcoins in general to experience a bullish move by the end of this week. Hence, a move above the 50-day SMA will trigger a 30% ascent to the immediate barrier at $22.23, coinciding with the 100-day SMA.
Interested investors can open long position from the current location and book profits around $22.23 to book roughly 30% gains.
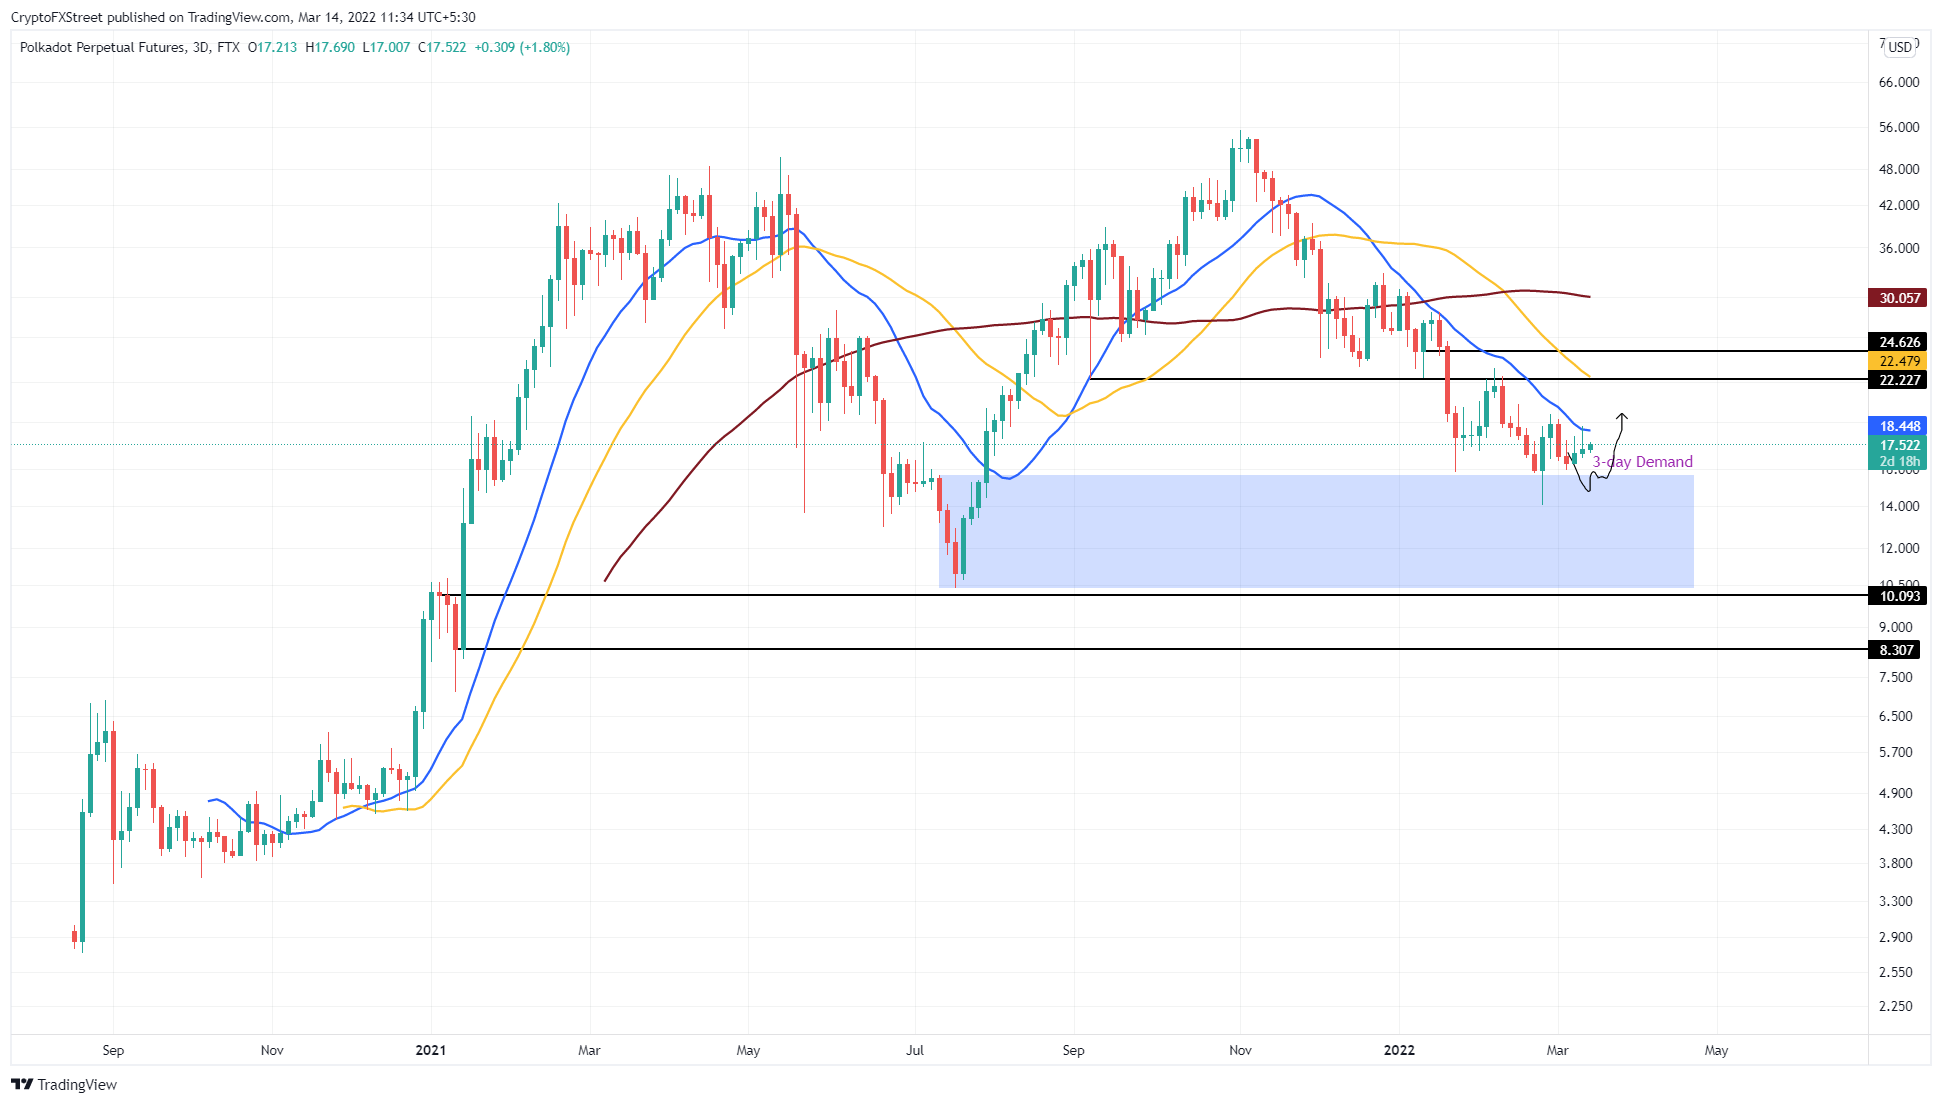
DOT/USDT 1-day chart
As bullish as the Polkadot price action might seem, it’s short-term future is determined by the big crypto due to the strong historical correlation between the two. Hence, a sudden flash crash in BTC could turn the bullish outlook sour in mere seconds.
If such a move were to occur it would push Polkadot price to produce a decisive move below the $10.36 barrier, creating a lower low and invalidating the bullish thesis for DOT. This development could also open the path for bears to retest the $10 psychological level or lower.
Author

Akash Girimath
FXStreet
Akash Girimath is a Mechanical Engineer interested in the chaos of the financial markets. Trying to make sense of this convoluted yet fascinating space, he switched his engineering job to become a crypto reporter and analyst.


