- Polkadot project is celebrating a year of parachains in its ecosystem that drive a broad range of cross-chain, interoperable web3 integrations.
- DOT price wiped out its gains from the past two weeks, amidst crypto market bloodbath.
- Polkadot’s token is at a risk of decline below the $6 level after yielding nearly 10% losses since February 9.
Polkadot, multichain for web3, is celebrating a year of parachains, blockchains connected to the DOT ecosystem. DOT price plummeted nearly 10% since February 9, analysts predict further decline in the web3 protocol’s native token.
Polkadot smart chain celebrates a year of parallel blockchains in its ecosystem
Polkadot is an Ethereum competitor and an ecosystem of smart contract parachains, parallel blockchains in the DOT ecosystem.
The top parachains, Moonbeam Network, Astar Network and Acala Network, won the first three auctions and drove a broad range of cross-chain, interoperable web3 integrations.
Several projects in the DeFi ecosystem emerged winners in Polkadot’s auctions, running parallel blockchains alongside DOT’s native chain.
1/ Continuing our series celebrating the first full year of parachains on Polkadot, let’s move on from DeFi to System Chains, Smart Contracts, and Social Media.
— Polkadot (@Polkadot) February 10, 2023
Read the thread and an in-depth blog for more detail on these exciting use cases: https://t.co/WToBrCsAGu pic.twitter.com/IyTVskQf3W
Despite bullish developments in its ecosystem and powering multiple DeFi and smart contract blockchain projects, DOT price is struggling to recoup its losses. DOT price yielded 8.7% losses since February 9.
DOT price is at risk of collapse below the $6 level
DOT, the native token of the Polkadot ecosystem wiped its weekly gains with the recent decline to $6.26. The token is currently trading at its weekly low and DOT price is at risk of decline below the $6 level.
On the 1D timeframe, DOT is in a multi-month downtrend, on the 4H chart, it is in an uptrend in an ascending channel.
The chart below shows the formation of a support zone between $6.22 and $6.59. DOT declined below the lower trendline forming the support zone and nosedived below the volume point-of-control (POC) at $6.22.
The Volume POC is a key level as it represents the price with the most liquidity and highest traded volume over a specific period of time. Polkadot price declined below two Exponential Moving Averages (EMAs) the 10-day and 50-day represented by red and blue lines on the chart below.
The 200-day EMA is acting as support for the token at $6.15. A close below the lower trendline forming the ascending channel could confirm a trend reversal and the downside targets are the 38.2% Fibonacci retracement at $6.03 and the 50% Fibonacci retracement at $5.70.
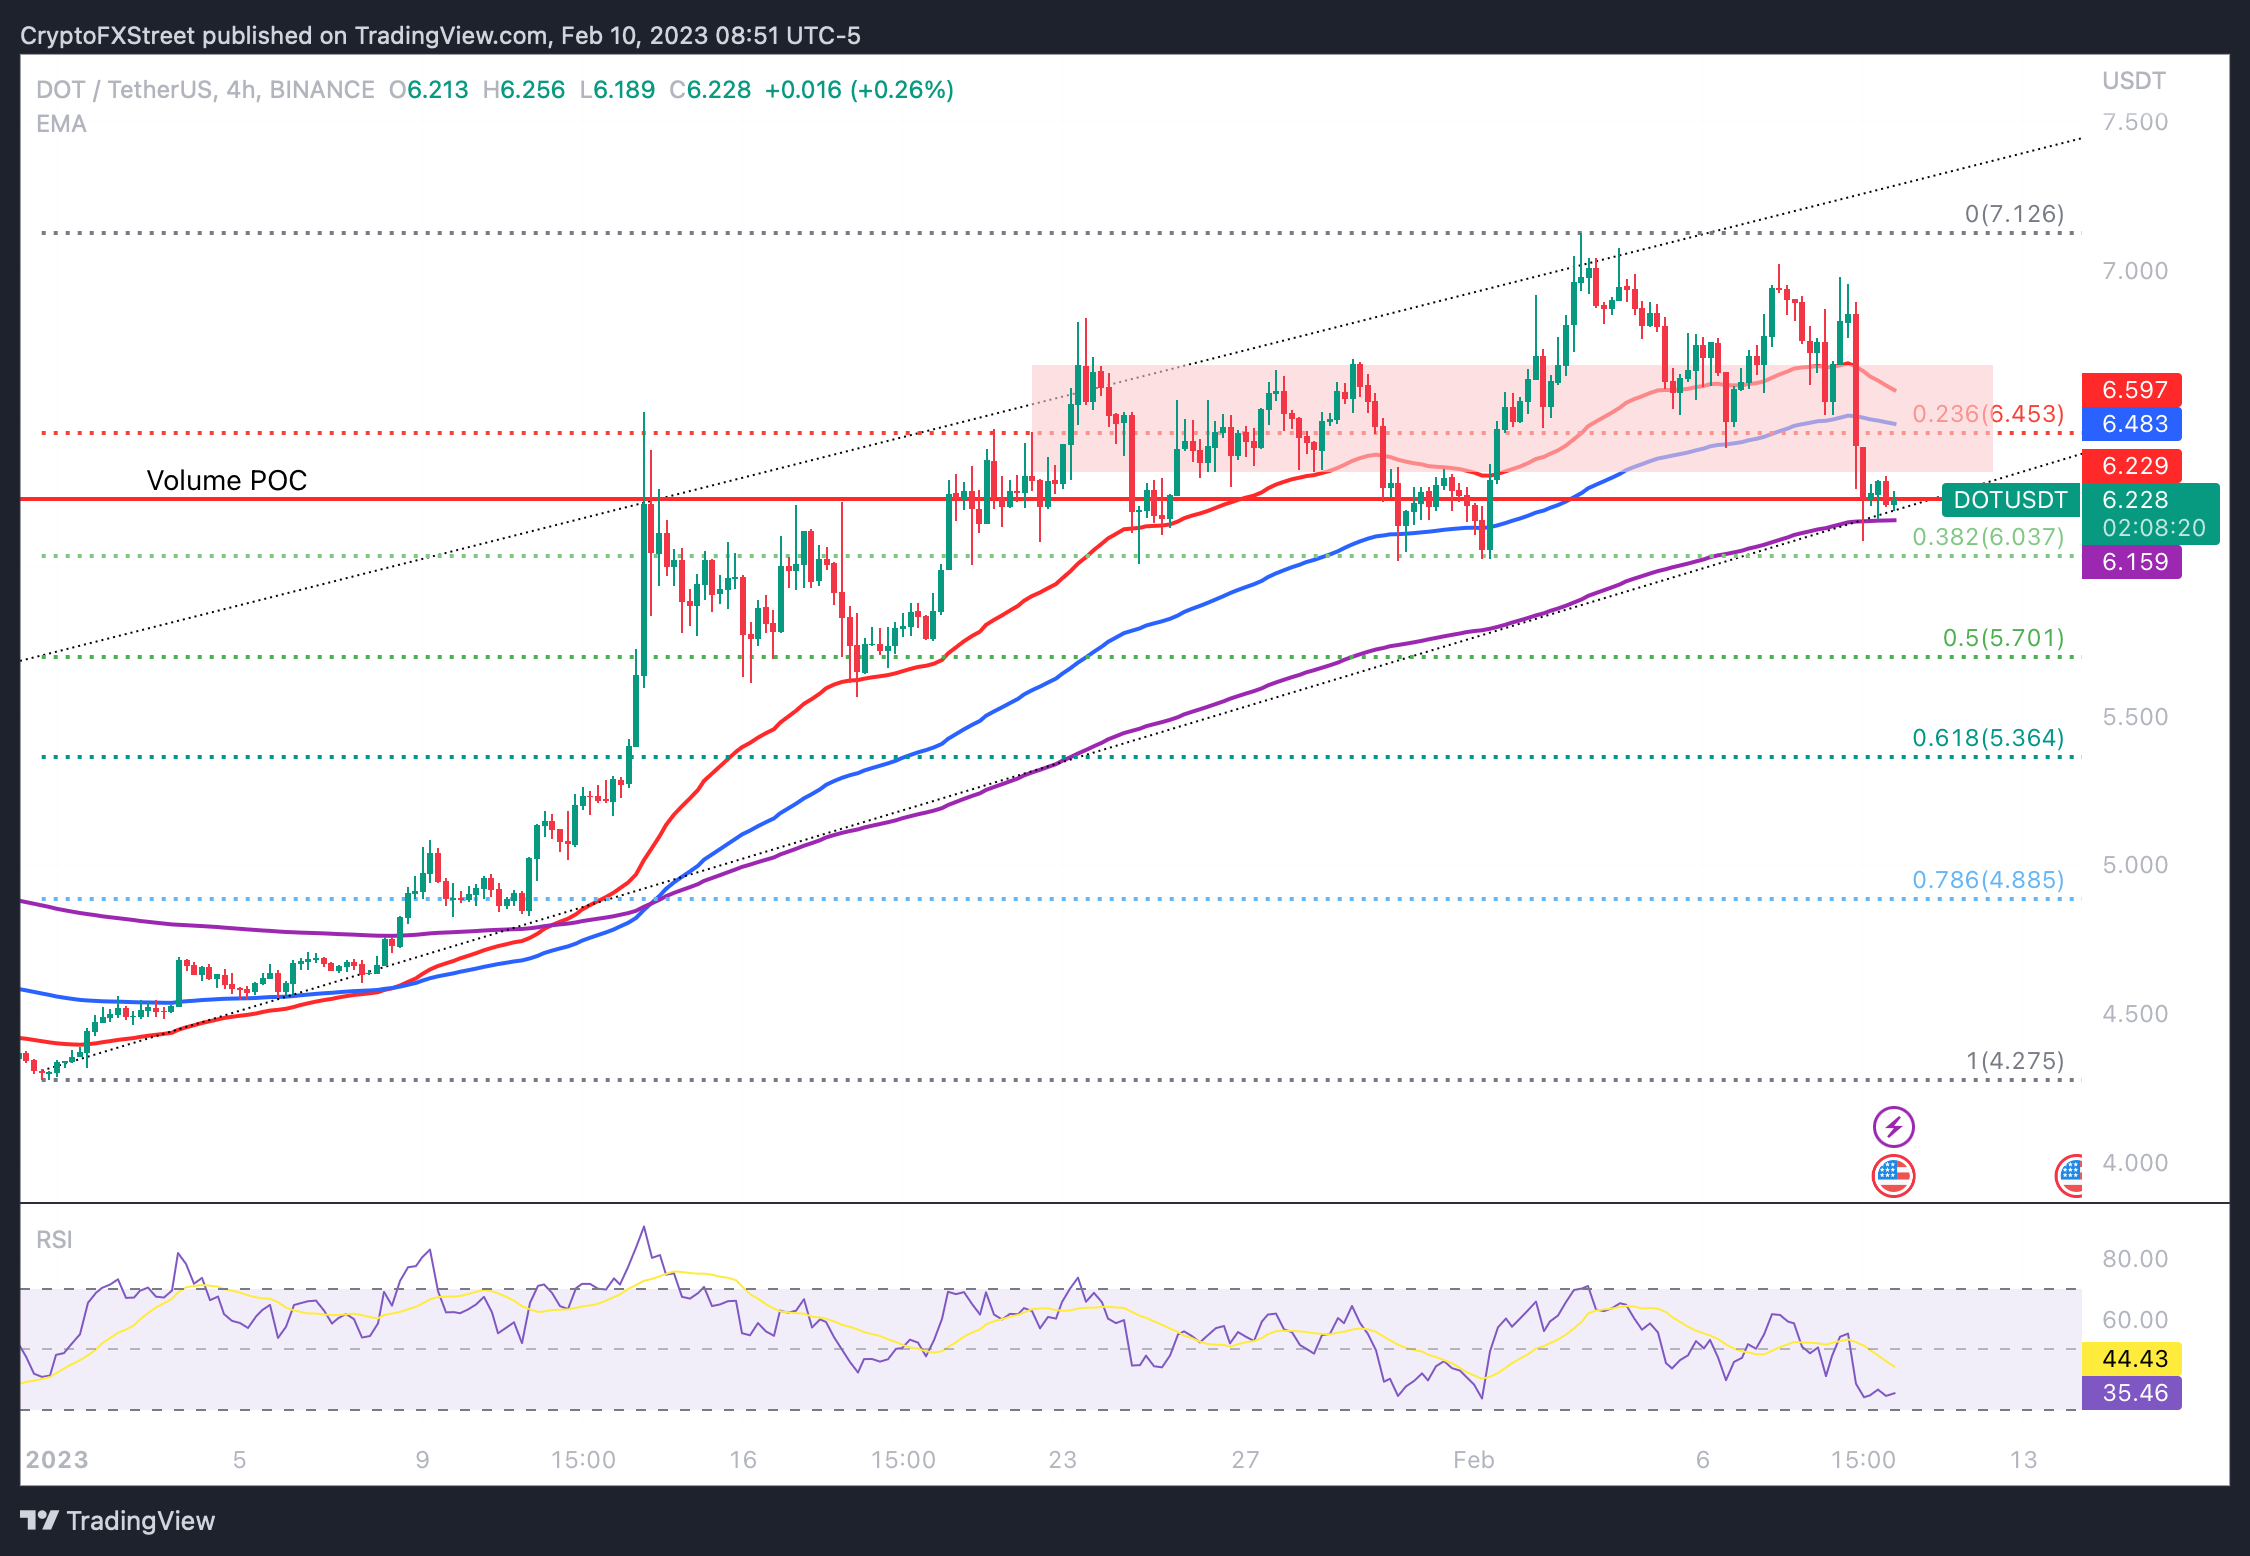
DOT/USDT price chart
There is a likelihood of a rebound from the lower trendline of the ascending channel, DOT price could enter the support zone between $6.22 and $6.59.
Relative Strength Index, a momentum indicator reads 35.46. RSI is well below the neutral level of 50 and it is important to note that the indicator reveals a bearish divergence. RSI has dropped to 35.46 for the first time since the first week of February and this has occurred only three times in 2023.
Polkadot’s short-term uptrend lacks the underlying strength and further downside correction is likely in DOT price.
Information on these pages contains forward-looking statements that involve risks and uncertainties. Markets and instruments profiled on this page are for informational purposes only and should not in any way come across as a recommendation to buy or sell in these assets. You should do your own thorough research before making any investment decisions. FXStreet does not in any way guarantee that this information is free from mistakes, errors, or material misstatements. It also does not guarantee that this information is of a timely nature. Investing in Open Markets involves a great deal of risk, including the loss of all or a portion of your investment, as well as emotional distress. All risks, losses and costs associated with investing, including total loss of principal, are your responsibility. The views and opinions expressed in this article are those of the authors and do not necessarily reflect the official policy or position of FXStreet nor its advertisers. The author will not be held responsible for information that is found at the end of links posted on this page.
If not otherwise explicitly mentioned in the body of the article, at the time of writing, the author has no position in any stock mentioned in this article and no business relationship with any company mentioned. The author has not received compensation for writing this article, other than from FXStreet.
FXStreet and the author do not provide personalized recommendations. The author makes no representations as to the accuracy, completeness, or suitability of this information. FXStreet and the author will not be liable for any errors, omissions or any losses, injuries or damages arising from this information and its display or use. Errors and omissions excepted.
The author and FXStreet are not registered investment advisors and nothing in this article is intended to be investment advice.
Recommended Content
Editors’ Picks

Bitcoin Weekly Forecast: BTC nosedives below $95,000 as spot ETFs record highest daily outflow since launch
Bitcoin price continues to edge down, trading below $95,000 on Friday after declining more than 9% this week. Bitcoin US spot ETFs recorded the highest single-day outflow on Thursday since their launch in January.

Bitcoin crashes to $96,000, altcoins bleed: Top trades for sidelined buyers
Bitcoin (BTC) slipped under the $100,000 milestone and touched the $96,000 level briefly on Friday, a sharp decline that has also hit hard prices of other altcoins and particularly meme coins.

Solana Price Forecast: SOL’s technical outlook and on-chain metrics hint at a double-digit correction
Solana (SOL) price trades in red below $194 on Friday after declining more than 13% this week. The recent downturn has led to $38 million in total liquidations, with over $33 million coming from long positions.

SEC approves Hashdex and Franklin Templeton's combined Bitcoin and Ethereum crypto index ETFs
The SEC approved Hashdex's proposal for a crypto index ETF. The ETF currently features Bitcoin and Ethereum, with possible additions in the future. The agency also approved Franklin Templeton's amendment to its Cboe BZX for a crypto index ETF.

Bitcoin: 2025 outlook brightens on expectations of US pro-crypto policy
Bitcoin (BTC) price has surged more than 140% in 2024, reaching the $100K milestone in early December. The rally was driven by the launch of Bitcoin Spot Exchange Traded Funds (ETFs) in January and the reduced supply following the fourth halving event in April.

Best Forex Brokers with Low Spreads
VERIFIED Low spreads are crucial for reducing trading costs. Explore top Forex brokers offering competitive spreads and high leverage. Compare options for EUR/USD, GBP/USD, USD/JPY, and Gold.