![]() Sheldon McIntyre, CMT
Sheldon McIntyre, CMT
Independent Analyst
- Polkadot price reaches for the 50% retracement of the May-July cyclical correction, but the 200-day simple moving average (SMA) pulls on it.
- DOT holds the July ascending trend line, provoking an extreme overbought condition on the daily Relative Strength Index (RSI).
- DOT is heading into the weekend with the potential to close with five consecutive positive weeks for the first time.
Polkadot price has realized a tremendous run since the July low, recording a 185% gain at today’s high. The rally has been interrupted by only seven negative days as it stretches to overtake the 200-day SMA on a daily closing basis. However, the alignment of the 200-day SMA with several highs in late May and June creates the first credible resistance for DOT since the July 7 high of $17.88. Simultaneously, the six-hour chart is flashing a bearish momentum divergence, intensifying the challenge now emerging for the digital coin.
Polkadot price rewrites the meaning of relentless
Polkadot price has established a leadership position for the cryptocurrency market, rising 185% since the July low while maintaining constant support at or near the July ascending trend line. The relentlessness of the rally has overtaken the resistance defined by the 38.2% Fibonacci retracement of the May-July correction at $25.78 and potentially the 200-day SMA today at $27.54 (depends on today's close).
A potential warning for future Polkadot price exploits is the emergence of a bearish momentum divergence on the six-hour chart at today’s high. The bearish momentum divergences at the August 7 and August 11 highs resulted in 14% and 12% pullbacks, respectively, but in neither case was DOT attempting to overcome a level or range of resistance as is the case now.
A pullback of 14% would drag Polkadot price below the July ascending trend line and put DOT within striking distance of the 50 six-hour SMA at $22.97.
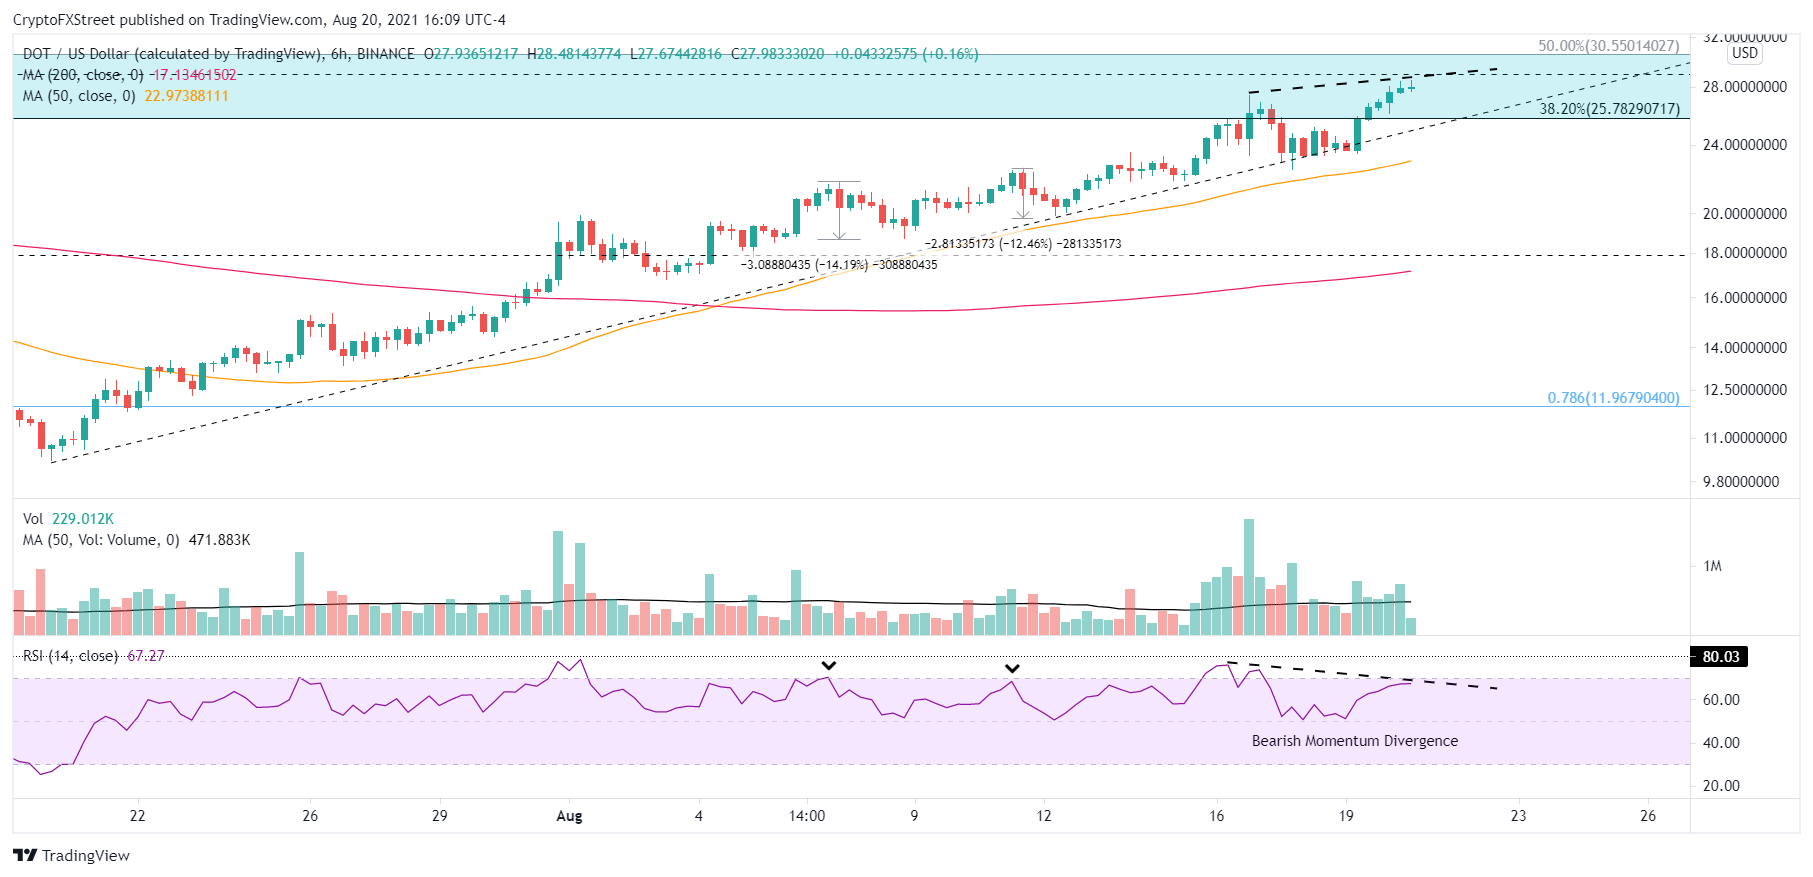
DOT/USD 6-hour chart
On the daily chart, Polkadot price has not registered a bearish momentum divergence. Instead, the daily RSI is nearing the highest reading since the February high, signaling an extreme overbought condition and raising the probabilities for a DOT reversal. The extreme reading coincides with today’s effort to clear the 200-day SMA and make a run to the 50% retracement of the May-July correction at $30.55.
Adding to the complexity on the DOT charts is the presence of Polkadot price congestion between the 38.2% and 50% retracement levels going back to the beginning of the year, including the late February low and the March and April lows. The price congestion halted the rebound following the May 19 collapse and two bounces in June.
To confirm the cautious outlook, Polkadot price needs to record a daily close below the 38.2% retracement level and the July ascending trend line, now at $24.57.
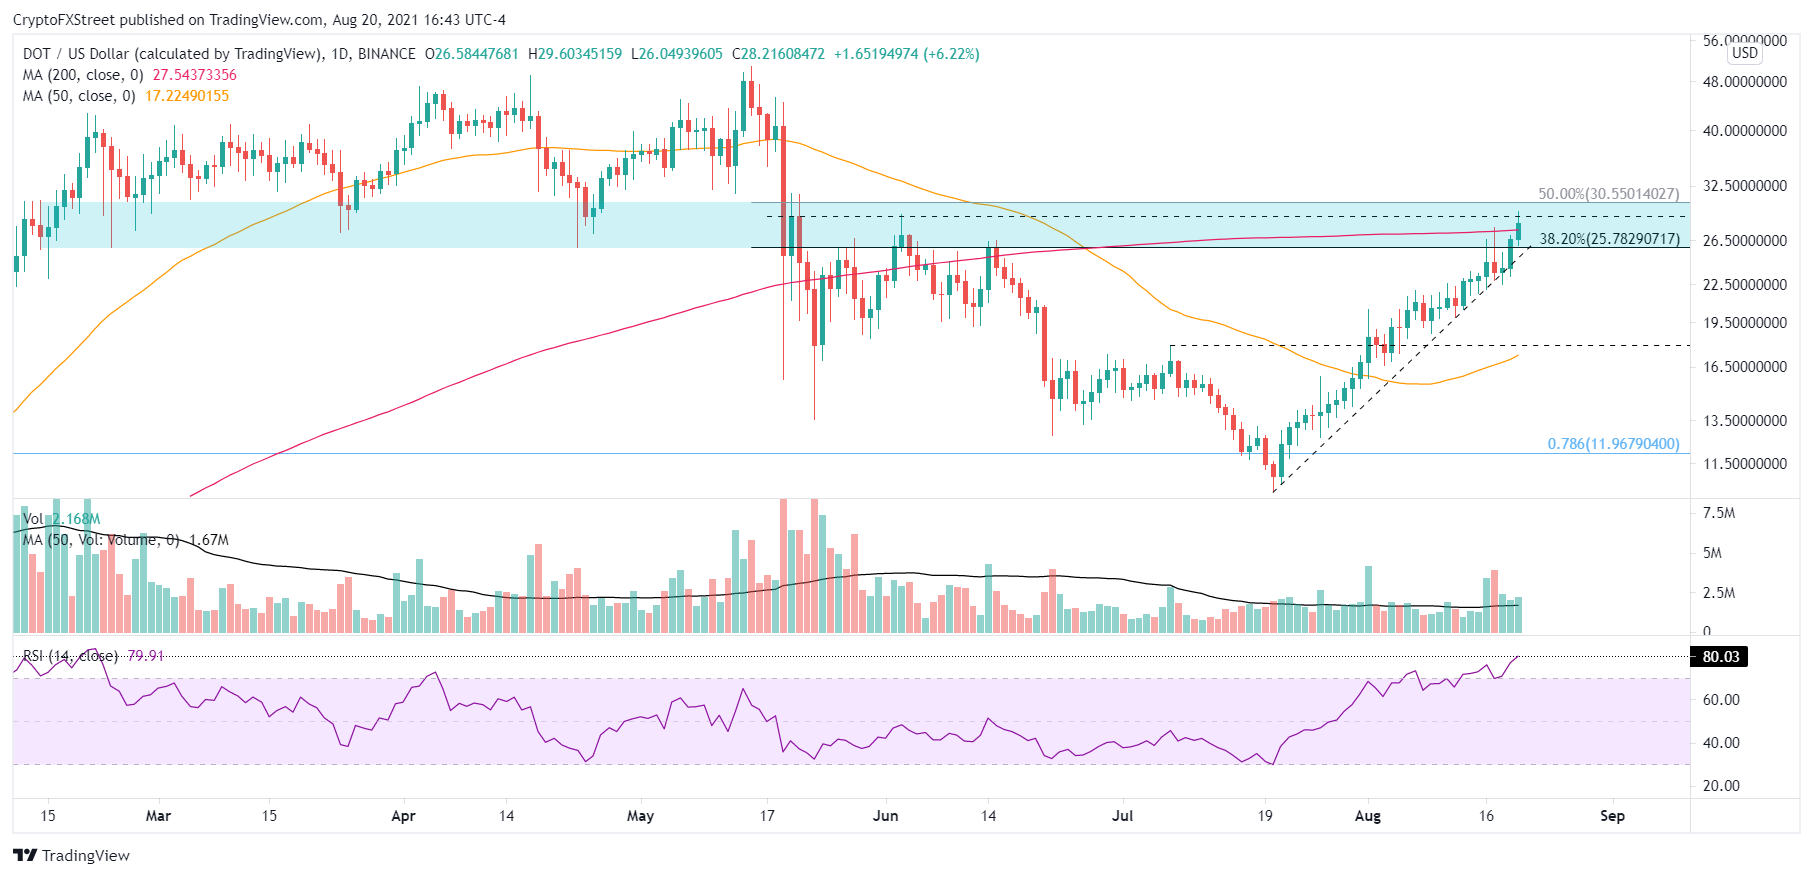
DOT/USD daily chart
A daily close above the 50% retracement at $30.55 would negate the cautious outlook and turn the resistance range into support, projecting better Polkadot price outcomes moving forward.
The catalysts are in place for a longer and deeper Polkadot price retracement, an extreme overbought reading on the daily RSI, the bearish momentum divergence on the DOT six-hour chart and the convergence of several significant highs and lows between the two Fibonacci levels.
Note: All information on this page is subject to change. The use of this website constitutes acceptance of our user agreement. Please read our privacy policy and legal disclaimer. Opinions expressed at FXstreet.com are those of the individual authors and do not necessarily represent the opinion of FXstreet.com or its management. Risk Disclosure: Trading foreign exchange on margin carries a high level of risk, and may not be suitable for all investors. The high degree of leverage can work against you as well as for you. Before deciding to invest in foreign exchange you should carefully consider your investment objectives, level of experience, and risk appetite. The possibility exists that you could sustain a loss of some or all of your initial investment and therefore you should not invest money that you cannot afford to lose. You should be aware of all the risks associated with foreign exchange trading, and seek advice from an independent financial advisor if you have any doubts.
Recommended Content
Editors’ Picks

Cardano Price Forecast: Sign of robust bullish reversal emerges despite dwindling DeFi TVL volume
Cardano rebounds to test resistance at $0.69 as technical indicator flashes a buy signal. A minor increase in the derivative Open Interest to $831 million suggests growing trader interest in ADA.

Crypto Today: Bitcoin's downside risks escalate as BTC spot ETF outflows extend
The cryptocurrency market is consolidating losses after starting the week amid high volatility. Bitcoin attempted to steady the uptrend above $106,000 but lost steam, resulting in a reversal to $105,204 at the time of writing on Tuesday.

Bitcoin falls below $106,000 as risk-off sentiment persists
Bitcoin price faces rejection around its $106,406 resistance level on Tuesday, hinting at a potential correction ahead. Market sentiment sours as growing Israel-Gaza tensions weigh on riskier assets, such as BTC.

Coinbase asset roadmap adds Ethena, ENA targets $0.34 breakout before listing
Ethena records its fourth consecutive positive day, signaling increased bullish momentum. Coinbase announces the addition of Ethena to the asset roadmap, making it tradable on the platform soon.

Bitcoin: BTC dips as profit-taking surges, but institutional demand holds strong
Bitcoin (BTC) is stabilizing around $106,000 on Friday, following three consecutive days of correction that have resulted in a near 3% decline so far this week. The correction in BTC prices was further supported by the profit-taking activity of its holders, which has reached a three-month high.

The Best brokers to trade EUR/USD
SPONSORED Discover the top brokers for trading EUR/USD in 2025. Our list features brokers with competitive spreads, fast execution, and powerful platforms. Whether you're a beginner or an expert, find the right partner to navigate the dynamic Forex market.