Polkadot price bound for 50% breakout if DOT bulls can overcome this hurdle
- Polkadot price is consolidating between two vital levels at $47.96 and $38.69.
- A decisive close above either of these levels will kick-start a new rally.
- DOT is likely to embark on a 50% ascent if it surpasses $47.96 due to the market’s bullishness.

Polkadot price is currently facing a decisive moment as it trades between two significantly troublesome barriers. While overcoming these hurdles will be trying, doing so will lead to a volatile move.
Polkadot price at make or break point
Polkadot price has risen roughly 75% over the past 24 days and is currently sitting between $47.96 and $38.69, two barriers that will determine the direction in which DOT will go next. The former barrier is sitting just under DOT’s all-time high at $49.78, therefore, investors already in the trade could choose that point to book profits, making it a challenging level to crack.
In a scenario where buyers manage to overcome the selling pressure and produce a decisive close above this barrier, it will open the path to a new uptrend. The 100% trend-based Fibonacci extension level at $53.90 is where the Polkadot price may make a new high.
Clearing this blockade will eventually push the DeFi token to the next barrier at $71.45, coinciding with the 161.8% trend-based Fibonacci extension level.
The ascent from the $47.96 to this record-high would constitute a 50% gain.
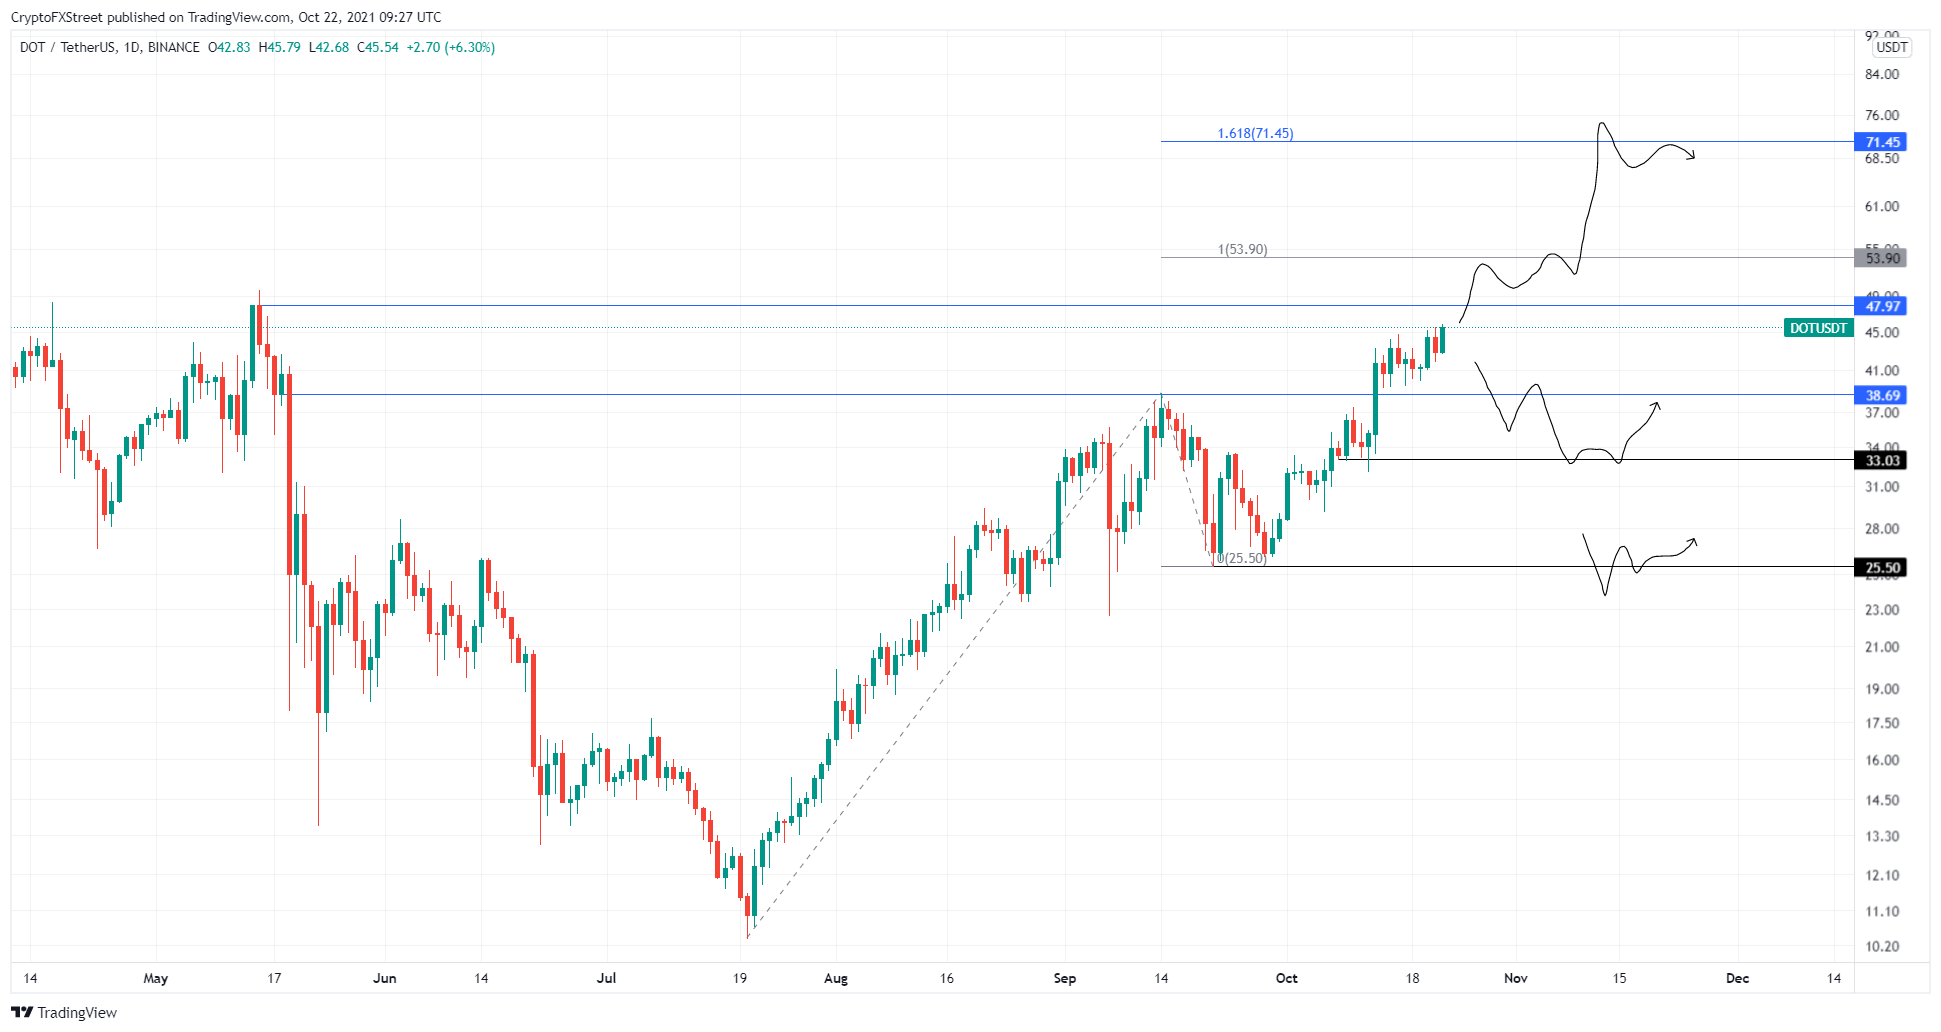
DOT/USDT 1-day chart
On the other hand, if the Polkadot price fails to slice through $47.96, it will indicate that buying pressure is waning. In this situation, DOT might revisit the $38.69 support floor, where the bulls can make a comeback.
If the Polkadot price flips this support level into resistance, it will trigger a 15% crash to $33.03. A breakdown of this level will lead to DOT retesting the $25.50 barrier, constituting a 33% descent from $38.69.
Author

Akash Girimath
FXStreet
Akash Girimath is a Mechanical Engineer interested in the chaos of the financial markets. Trying to make sense of this convoluted yet fascinating space, he switched his engineering job to become a crypto reporter and analyst.


