- Polkadot price holds a solid and comfortable gain to close the week.
- DOT price is nowhere near a turnaround as the bear market still dictates the overall price direction.
- Expect to see a further squeeze against support before it is set to break another barrier lower.
Polkadot (DOT) price is set to close out the week with a solid gain, although it has undergone some retreat near and over the weekend. Although this is a welcome result for traders, it does not mean anything in the overall bear market cycle. As the current week was unable to close above the high of last week, it was also unable to close above an important technical handle that would at least be favorable for more profits to come in the coming weeks.
DOT price is still under pressure from last week’s rejection
Polkadot price analyzed on a broader timeframe shows a logic as to why this bullish candle is just a mere drop on a hot plate as the bear cycle is still very much intact. Last week bulls underwent a steadfast rejection after trying to break above the 55-day Simple Moving Average (SMA), around $7.75, followed by DOT price trading lower. The close this week bears some profit but unfortunately was unable to break above the high of last week and that 55- day SMA hurdle.
DOT price is thus going nowhere and, after this small effort for a bounce, will only go further south. Polkadot price will see bulls being squeezed against that support level at $6.92 before that level will break. With the start of a new month, fresh pivots are plotted on the chart, and the monthly S1 falls perfectly in line with the low of 2022 at $6. If that level does not hold, the monthly S2 at $5 could be the one to watch.
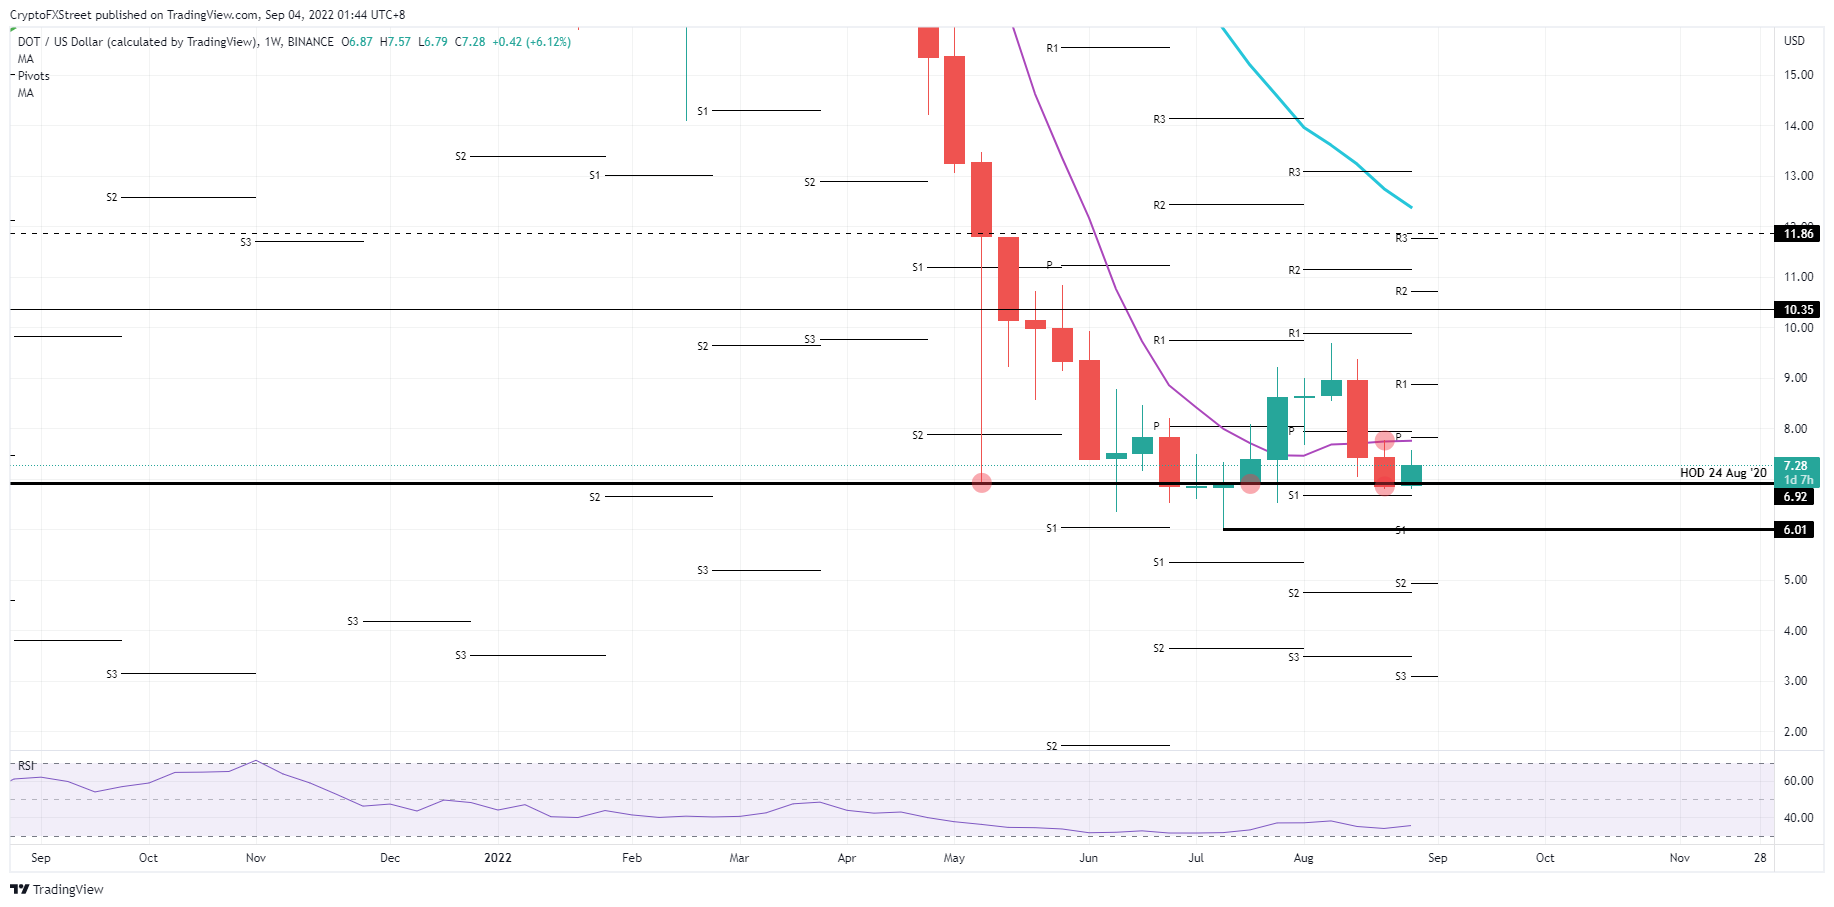
DOT/USD Weekly chart
The bounce could see some continuation into next week and might rather see bears being squeezed against the 55-day SMA. Once broken, expect to see a massive inflow of bulls with a steep rally. Expect DOT price action to rally to $10 and print a new high since June.
Information on these pages contains forward-looking statements that involve risks and uncertainties. Markets and instruments profiled on this page are for informational purposes only and should not in any way come across as a recommendation to buy or sell in these assets. You should do your own thorough research before making any investment decisions. FXStreet does not in any way guarantee that this information is free from mistakes, errors, or material misstatements. It also does not guarantee that this information is of a timely nature. Investing in Open Markets involves a great deal of risk, including the loss of all or a portion of your investment, as well as emotional distress. All risks, losses and costs associated with investing, including total loss of principal, are your responsibility. The views and opinions expressed in this article are those of the authors and do not necessarily reflect the official policy or position of FXStreet nor its advertisers. The author will not be held responsible for information that is found at the end of links posted on this page.
If not otherwise explicitly mentioned in the body of the article, at the time of writing, the author has no position in any stock mentioned in this article and no business relationship with any company mentioned. The author has not received compensation for writing this article, other than from FXStreet.
FXStreet and the author do not provide personalized recommendations. The author makes no representations as to the accuracy, completeness, or suitability of this information. FXStreet and the author will not be liable for any errors, omissions or any losses, injuries or damages arising from this information and its display or use. Errors and omissions excepted.
The author and FXStreet are not registered investment advisors and nothing in this article is intended to be investment advice.
Recommended Content
Editors’ Picks
Ripple update: XRP shows resilience in recent crypto market sell-off
Ripple's XRP is up 6% on Tuesday following a series of on-chain metrics, which reveals investors in the remittance-based token held onto their assets despite the wider crypto market sell-off last week.
Floki DAO floats liquidity provisioning for a Floki ETP in Europe
Floki DAO — the organization that manages the memecoin Floki — has proposed allocating a portion of its treasury to an asset manager in a bid to launch an exchange-traded product (ETP) in Europe, allowing institutional investors to gain exposure to the memecoin.

Six Bitcoin mutual funds to debut in Israel next week: Report
Six mutual funds tracking the price of bitcoin (BTC) will debut in Israel next week after the Israel Securities Authority (ISA) granted permission for the products, Calcalist reported on Wednesday.

Crypto Today: BTC hits new Trump-era low as Chainlink, HBAR and AAVE lead market recovery
The global cryptocurrency market cap shrank by $500 billion after the Federal Reserve's hawkish statements on December 17. Amid the market crash, Bitcoin price declined 7.2% last week, recording its first weekly timeframe loss since Donald Trump’s re-election.

Bitcoin: 2025 outlook brightens on expectations of US pro-crypto policy
Bitcoin price has surged more than 140% in 2024, reaching the $100K milestone in early December. The rally was driven by the launch of Bitcoin Spot ETFs in January and the reduced supply following the fourth halving event in April.

Best Forex Brokers with Low Spreads
VERIFIED Low spreads are crucial for reducing trading costs. Explore top Forex brokers offering competitive spreads and high leverage. Compare options for EUR/USD, GBP/USD, USD/JPY, and Gold.