- Polkadot price is undergoing a retracement after it failed to hold above a supply zone ranging from $19.14 to $20.61.
- The co-founder mentions that they have recently deployed six parachains, and their effects will be apparent in the near future.
- A resurgence of buyers that flip the said supply zone into a demand area will invalidate the bearish thesis.
Polkadot price has rallied exponentially from July 20 to August 8, but things took a turn as the cryptocurrency market began to reverse. In addition to the overall selling pressure, a technical indicator flashed a sell signal, further exacerbating the descent.
Early days in the Polkadot land
Referring to the 2020 DeFi Summer and multiple blockchains like Aave, Sushi and others that took off, Polkadot co-founder Rob Habermeier explained during an interview with The Scoop that Polkadot is still in the early stages.
He explains that Polkadot recently launched the first version of parachains on the Kusama Network. Unlike many blockchains, Polkadot establishes application-specific data structures, known as parachains, that can focus on a specific industry sector.
Touching more on the topic, Habermeier added,
There are six parachains deployed on the Kusama network. Those are focusing on DeFi, smart contracts, Layer 2 scaling, identity secure compute [,which] are some of the first projects we are starting to see emerge on Polkadot.
Since the “parachain season is just beginning," the co-founder expects these projects to have their community and grow as time progresses and even have applications built on top of them.
Polkadot price needs to find stable ground
Polkadot price rallied roughly 110% between July 20 and August 8. After piercing the supply zone ranging from $19.14 to $20.61, and setting up a swing high at $21.72, DOT has dropped 13%.
This descent has pushed Polkadot price below the said area of resistance, which is a bearish sign. While the downswing was evident after such a massive uptrend, investors can expect it to extend lower, especially since the Momentum Reversal Indicator (MRI) has flashed a sell signal in the form of a red ‘one’ candlestick on the 12-hour chart. This setup often forecasts a one-to-four candlestick correction.
The immediate support level at $18.34 is the first level sellers will encounter. Breaching $18.34 will push DOT down to $17.01, roughly 12% from the current position, $19.34.
Although it is unsure if the sell-off will continue after $17.01 if the recent upswing was a shift in the narrative to bullish, investors can expect an upswing to originate here.
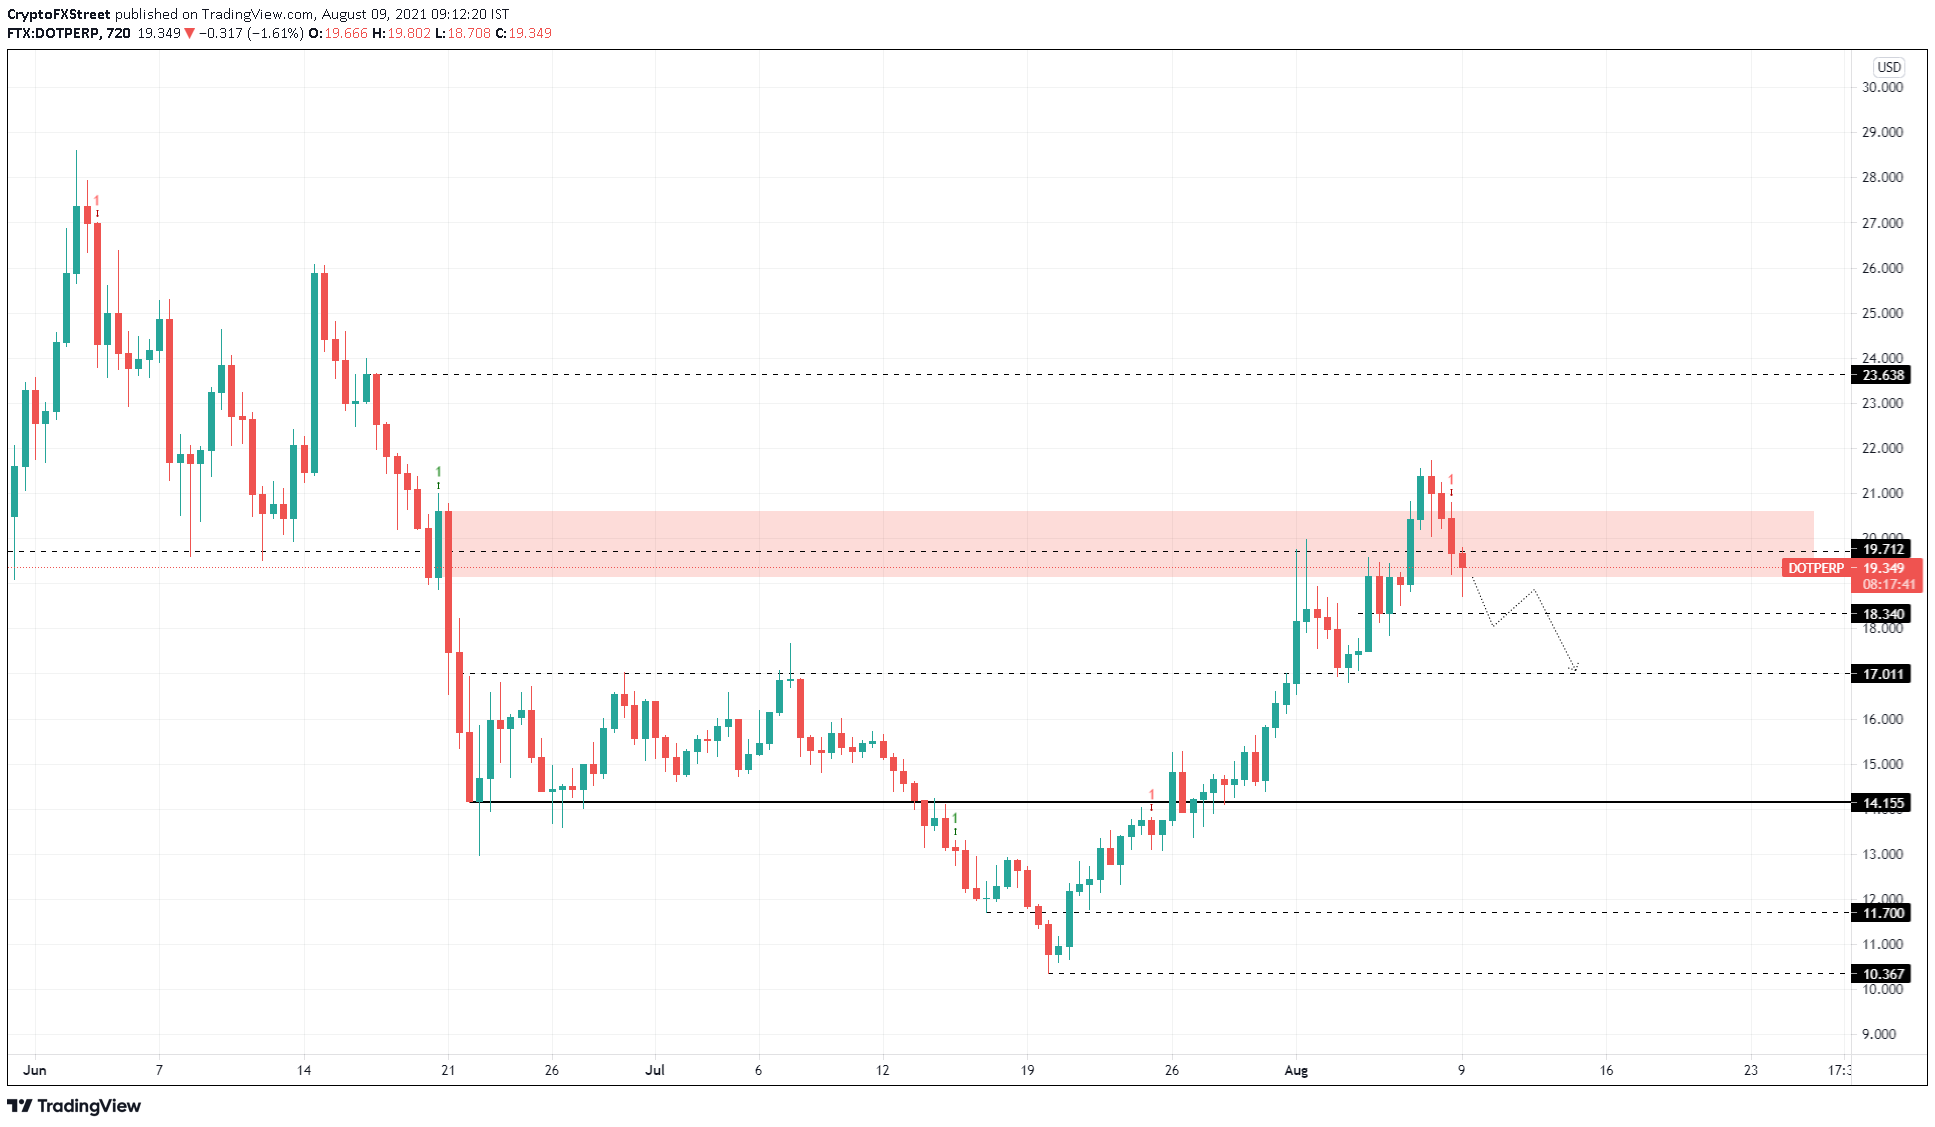
DOT/USDT 12-hour chart
Regardless of the bearish pressure, if the buyers make a comeback pushing Polkadot price above the supply zone’s upper limit at $19.14, it will indicate that an upswing is likely to survive.
A confirmation of the bullish outlook will arrive after DOT price produces a bounce off the $19.14 barrier. If this were to occur, market participants could expect a 15% ascent to $23.64.
Information on these pages contains forward-looking statements that involve risks and uncertainties. Markets and instruments profiled on this page are for informational purposes only and should not in any way come across as a recommendation to buy or sell in these assets. You should do your own thorough research before making any investment decisions. FXStreet does not in any way guarantee that this information is free from mistakes, errors, or material misstatements. It also does not guarantee that this information is of a timely nature. Investing in Open Markets involves a great deal of risk, including the loss of all or a portion of your investment, as well as emotional distress. All risks, losses and costs associated with investing, including total loss of principal, are your responsibility. The views and opinions expressed in this article are those of the authors and do not necessarily reflect the official policy or position of FXStreet nor its advertisers. The author will not be held responsible for information that is found at the end of links posted on this page.
If not otherwise explicitly mentioned in the body of the article, at the time of writing, the author has no position in any stock mentioned in this article and no business relationship with any company mentioned. The author has not received compensation for writing this article, other than from FXStreet.
FXStreet and the author do not provide personalized recommendations. The author makes no representations as to the accuracy, completeness, or suitability of this information. FXStreet and the author will not be liable for any errors, omissions or any losses, injuries or damages arising from this information and its display or use. Errors and omissions excepted.
The author and FXStreet are not registered investment advisors and nothing in this article is intended to be investment advice.
Recommended Content
Editors’ Picks

XRP Price Prediction: Bearish technicals, on-chain indicators signal 68% potential crash
XRP faces increasing bearish sentiment from macro, micro and fundamental factors in April. Weak on-chain indicators ranging from network growth, total supply and active addresses reinforce an impending crash.

Bitcoin Price Forecast: Tariff volatility sweeps over $200 billion from crypto markets
Bitcoin price hovers around $83,000 on Thursday after it failed to close above the $85,000 resistance level the previous day. Volatility fueled by Trump’s tariffs swept $200 billion from total market capitalization, liquidating over $178 million in BTC.

SOL is the winner as Solana chain turns into battleground for meme coin launchpad and DEX
Solana (SOL) gains nearly 2% in the last 24 hours and trades at 118.28 at the time of writing on Thursday. A Decentralized Exchange (DEX) and a meme coin launchpad built on the Solana blockchain have waged a war for users and compete for the trade volume on the chain.

Shibarium, built for the Shiba Inu blockchain, reaches 1 billion in transactions in 18 months after its launch
Shibarium, a Layer-2 blockchain for the Shiba Inu ecosystem, reaches 1 billion transactions 18 months after its launch. This milestone reflects growing adoption and Shibarium’s robust performance.

Bitcoin: BTC remains calm before a storm
Bitcoin's price has been consolidating between $85,000 and $88,000 this week. A K33 report explains how the markets are relatively calm and shaping up for volatility as traders absorb the tariff announcements. PlanB’s S2F model shows that Bitcoin looks extremely undervalued compared to Gold and the housing market.

The Best brokers to trade EUR/USD
SPONSORED Discover the top brokers for trading EUR/USD in 2025. Our list features brokers with competitive spreads, fast execution, and powerful platforms. Whether you're a beginner or an expert, find the right partner to navigate the dynamic Forex market.