- Pepe price is up almost 10% in the last 24 hours, after an unexpected rise on August 8 in the afternoon of the US session.
- The surge has catapulted Pepe coin market cap around 7% to approach the $470 million market capitalization mark.
- However, PEPE must record a 4-hour candlestick close above $0.000001362 for a confirmed uptrend.
Pepe price turned bullish during the afternoon of the US session, recording a surge that had not been seen in a while. The rally comes despite the lack of activity on the meme coin’s social media network, raising eyebrows about what may have sparked the surge.
Pepe coin price rises 10% after prolonged stagnation
Pepe price recorded a 10% surge on August 8, rising from $0.000001102 to an intra-day high of $0.000001230 in an unexpected move considering the recent mute in the network’s social media. While the surge catapulted the recently sensational meme coin to the $470 million mark in market capitalization, the breakout appears unsustainable, meaning a correction may be imminent.
At the time of writing, Pepe price is confronting the 50-day Exponential Moving Average (EMA) at $0.000001190. An increase in selling pressure above this level could see the dethroned king of meme coins ascend to breach the $0.000001212 resistance level to collect buy-side liquidity.
Credit to liquidity collection’s unique ability to stabilize the market, Pepe coin could extend north, potentially tagging the 100-day EMA at $0.000001260 or, in a highly bullish case, tag the 200-day EMA at $0.000001339.
The Relative Strength Index (RSI) is moving up, while the Awesome Oscillators (AO) histograms are soaked in green and edging toward the positive, suggesting rising momentum.
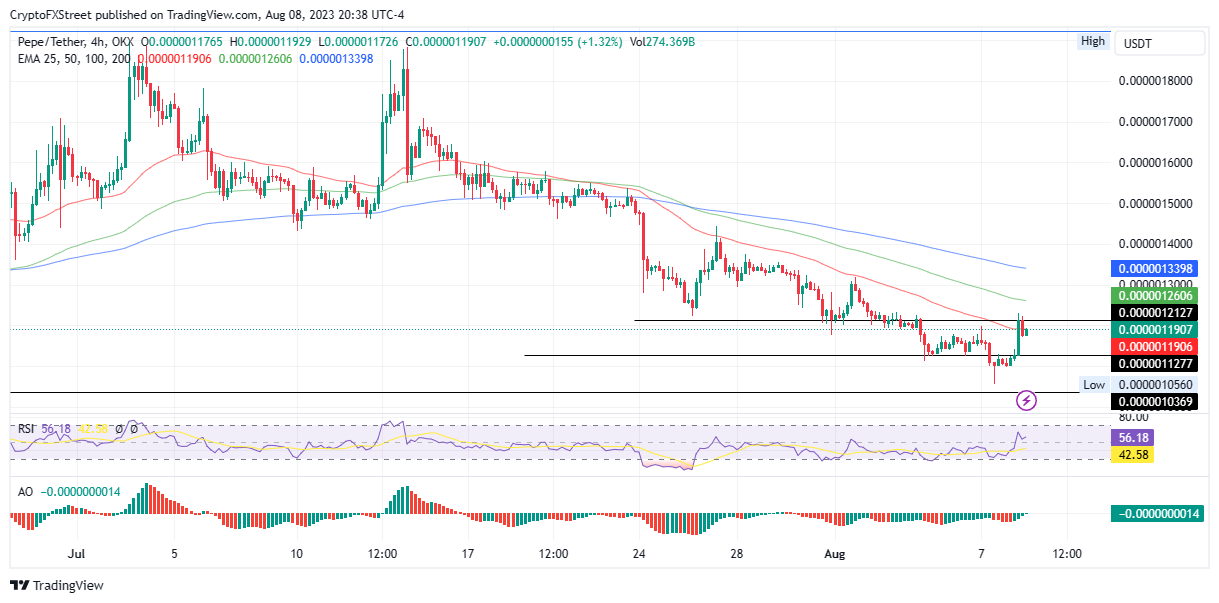
PEPE/USDT 4-hour chart
On the flip side, Pepe price bullish outlook seems unsustainable, and the uptrend could prove premature. The ensuing selling pressure could see the frog-themed meme coin retrace toward the $0.000001127 support level or, in the dire case, extend a leg south to tag the $0.000001036 support floor.
On-chain metric
Data from IntoTheBlock’s Global In/Out of the Money (GIOM) chart shows robust resistance between the $0.000001000 to $0.000002000 range. Any efforts by the bulls to break the price from this range would be met by selling pressure from 37,840 addresses which bought approximately 205.19 trillion PEPE tokens at an average price of $0.000001000.
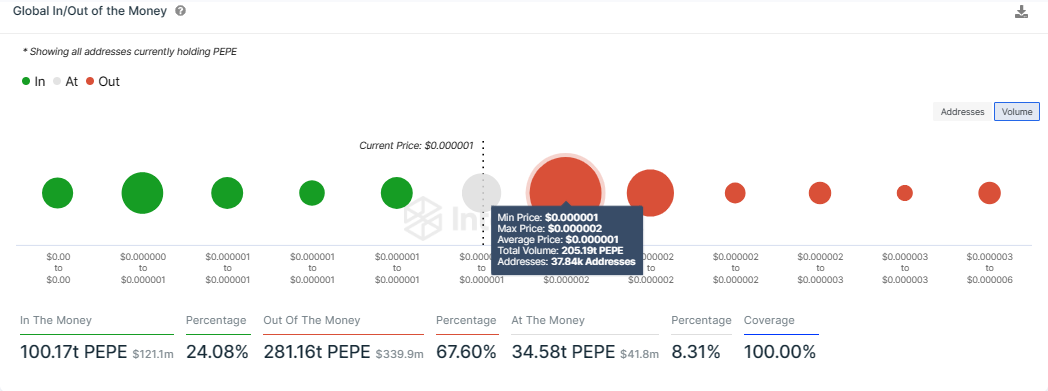
PEPE IntoTheBlock
Cryptocurrency metrics FAQs
What is circulating supply?
The developer or creator of each cryptocurrency decides on the total number of tokens that can be minted or issued. Only a certain number of these assets can be minted by mining, staking or other mechanisms. This is defined by the algorithm of the underlying blockchain technology. Since its inception, a total of 19,445,656 BTCs have been mined, which is the circulating supply of Bitcoin. On the other hand, circulating supply can also be decreased via actions such as burning tokens, or mistakenly sending assets to addresses of other incompatible blockchains.
What is market capitalization?
Market capitalization is the result of multiplying the circulating supply of a certain asset by the asset’s current market value. For Bitcoin, the market capitalization at the beginning of August 2023 is above $570 billion, which is the result of the more than 19 million BTC in circulation multiplied by the Bitcoin price around $29,600.
What is trading volume?
Trading volume refers to the total number of tokens for a specific asset that has been transacted or exchanged between buyers and sellers within set trading hours, for example, 24 hours. It is used to gauge market sentiment, this metric combines all volumes on centralized exchanges and decentralized exchanges. Increasing trading volume often denotes the demand for a certain asset as more people are buying and selling the cryptocurrency.
What is funding rate?
Funding rates are a concept designed to encourage traders to take positions and ensure perpetual contract prices match spot markets. It defines a mechanism by exchanges to ensure that future prices and index prices periodic payments regularly converge. When the funding rate is positive, the price of the perpetual contract is higher than the mark price. This means traders who are bullish and have opened long positions pay traders who are in short positions. On the other hand, a negative funding rate means perpetual prices are below the mark price, and hence traders with short positions pay traders who have opened long positions.
Information on these pages contains forward-looking statements that involve risks and uncertainties. Markets and instruments profiled on this page are for informational purposes only and should not in any way come across as a recommendation to buy or sell in these assets. You should do your own thorough research before making any investment decisions. FXStreet does not in any way guarantee that this information is free from mistakes, errors, or material misstatements. It also does not guarantee that this information is of a timely nature. Investing in Open Markets involves a great deal of risk, including the loss of all or a portion of your investment, as well as emotional distress. All risks, losses and costs associated with investing, including total loss of principal, are your responsibility. The views and opinions expressed in this article are those of the authors and do not necessarily reflect the official policy or position of FXStreet nor its advertisers. The author will not be held responsible for information that is found at the end of links posted on this page.
If not otherwise explicitly mentioned in the body of the article, at the time of writing, the author has no position in any stock mentioned in this article and no business relationship with any company mentioned. The author has not received compensation for writing this article, other than from FXStreet.
FXStreet and the author do not provide personalized recommendations. The author makes no representations as to the accuracy, completeness, or suitability of this information. FXStreet and the author will not be liable for any errors, omissions or any losses, injuries or damages arising from this information and its display or use. Errors and omissions excepted.
The author and FXStreet are not registered investment advisors and nothing in this article is intended to be investment advice.
Recommended Content
Editors’ Picks
Crypto Today: Cardano, XLM, FLOKI lead $3.1 trillion rally, Russia bans crypto mining, Bitcoin eyes $95K
Cardano (ADA) price action ADA’s ongoing rally has been attributed to rumors that the Trump administration could collaborate with the Cardano network to build a blockchain voting system.
Trump administration allegedly seeks to create new crypto position in White House
President-elect Donald Trump and his team are reportedly seeking to introduce a new White House position for crypto policy, Bloomberg reported on Wednesday.
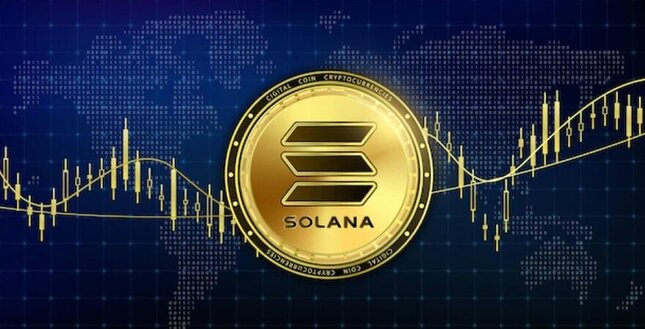
Solana Price Forecast: Traders move 6.7B SOL as bulls target all-time highs
Solana price has succumbed to a 7% dip after rejecting the $250 resistance on Monday. Negative shifts in vital trading indicators suggest bears could delay the all-time high breakout target.
FLOKI to go live on Coinbase few days after the exchange listed PEPE and WIF
Floki Inu (FLOKI) is down 5% on Wednesday following crypto exchange Coinbase's announcement that the token will begin trading on its platform over the next 24 hours.
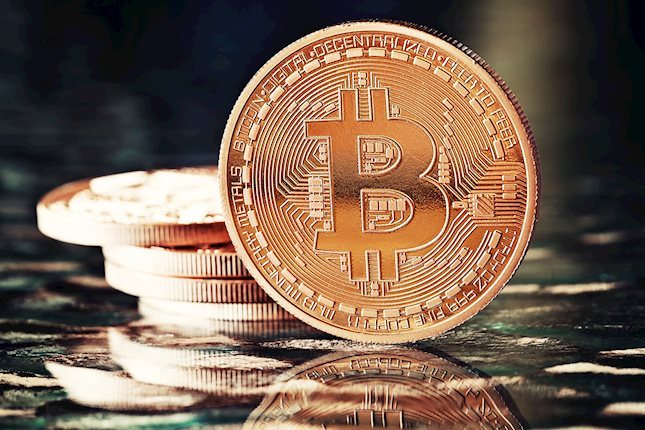
Bitcoin: New high of $100K or correction to $78K?
Bitcoin surged to a new all-time high of $93,265 in the first half of the week, followed by a slight decline in the latter half. Reports highlight that Bitcoin’s current level is still not overvalued and could target levels above $100,000 in the coming weeks.

Best Forex Brokers with Low Spreads
VERIFIED Low spreads are crucial for reducing trading costs. Explore top Forex brokers offering competitive spreads and high leverage. Compare options for EUR/USD, GBP/USD, USD/JPY, and Gold.