- PEPE had outperformed industry peers like Dogecoin in daily trading volumes last week, recording $227K and $168K, respectively.
- However, tables have turned, with PEPE showing $116K against DOGE's $187K to suggest smart money investors show a refocus.
- Accordingly, the meme coin's price action has formed a descending triangle in the 2-hour timeframe, forecasting a 25% downswing.
Pepe (PEPE) price has shown a lack of buyer participation throughout May, switching between neutral and bearish biases as the meme coin's hype and sensation eased. The lack of momentum for PEPE was so extreme that it failed to react to Bitcoin (BTC) price's influence over the weekend as crypto markets rallied.
Also Read: Bitcoin sees capital inflow as Biden, McCarthy agree to raise US debt ceiling
Pepe (PEPE) price has left meme coin enthusiasts in awe after losing ground against Dogecoin in terms of daily trading volume. Last week, PEPE and DOGE recorded $227K and $168K daily trading volumes, respectively, against this week's $116K vs. $187K for DOGE. This suggests smart money investors have switched focus to the king of meme coins.
Also Read: Dogecoin retakes meme coin throne as Shiba Inu, Pepe mania fades
Pepe price action consolidates in a descending triangle
While nothing is interesting for PEPE on higher timeframes, the 2-hour timeframe shows Pepe price action has formed a descending triangle. This chart pattern is often bearish, indicating a potential price drop in the future. The pattern is visible when the asset's price action records a series of lower highs while the support level remains constant. This means the asset supply is increasing against a weakening in demand.
Pepe price is sitting on immediate support at around $0.00000141 while confronting the $0.00000147 resistance marked by the downtrend line of the governing pattern. A break below the triangle's base at the $0.00000137 level could trigger a selling trend, potentially to the May 12 lows around the $0.00000106 support flow.
The Relative Strength Index (RSI) and the Moving Average Convergence Divergence (MACD) indicators add credence to the bearish thesis. Their positions below the midline indicate that bears are leading the PEPE market.
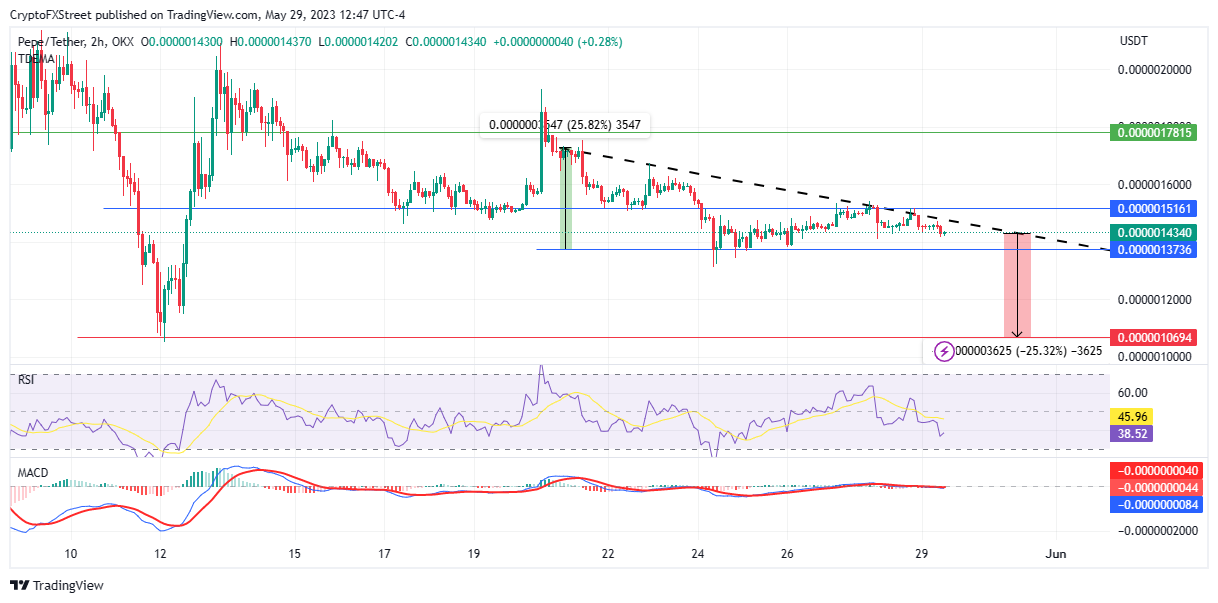
PEPE/USDT 2-Hour Chart
Conversely, a resurgence by bulls could see Pepe coin breach the downtrend line resistance level at $0.00000147 before extending a neck up to tag the $0.00000151 resistance level, clearing the path for further gains.
In a highly bullish case, Pepe price could ascend to tag the $0.00000178 resistance level, reclaiming the May 20 high. This move would denote a 25% upswing from the current price level. Although rare, such a scenario is possible considering the RSI had turned north, indicating a reentry of sidelined investors. If this trajectory is sustained, the RSI could soon cross above the yellow band, signaling a call to buy PEPE. Market players heeding this call could be bullish for the meme coin.
Information on these pages contains forward-looking statements that involve risks and uncertainties. Markets and instruments profiled on this page are for informational purposes only and should not in any way come across as a recommendation to buy or sell in these assets. You should do your own thorough research before making any investment decisions. FXStreet does not in any way guarantee that this information is free from mistakes, errors, or material misstatements. It also does not guarantee that this information is of a timely nature. Investing in Open Markets involves a great deal of risk, including the loss of all or a portion of your investment, as well as emotional distress. All risks, losses and costs associated with investing, including total loss of principal, are your responsibility. The views and opinions expressed in this article are those of the authors and do not necessarily reflect the official policy or position of FXStreet nor its advertisers. The author will not be held responsible for information that is found at the end of links posted on this page.
If not otherwise explicitly mentioned in the body of the article, at the time of writing, the author has no position in any stock mentioned in this article and no business relationship with any company mentioned. The author has not received compensation for writing this article, other than from FXStreet.
FXStreet and the author do not provide personalized recommendations. The author makes no representations as to the accuracy, completeness, or suitability of this information. FXStreet and the author will not be liable for any errors, omissions or any losses, injuries or damages arising from this information and its display or use. Errors and omissions excepted.
The author and FXStreet are not registered investment advisors and nothing in this article is intended to be investment advice.
Recommended Content
Editors’ Picks

Bitcoin Weekly Forecast: BTC nosedives below $95,000 as spot ETFs record highest daily outflow since launch
Bitcoin price continues to edge down, trading below $95,000 on Friday after declining more than 9% this week. Bitcoin US spot ETFs recorded the highest single-day outflow on Thursday since their launch in January.

Bitcoin crashes to $96,000, altcoins bleed: Top trades for sidelined buyers
Bitcoin (BTC) slipped under the $100,000 milestone and touched the $96,000 level briefly on Friday, a sharp decline that has also hit hard prices of other altcoins and particularly meme coins.

Solana Price Forecast: SOL’s technical outlook and on-chain metrics hint at a double-digit correction
Solana (SOL) price trades in red below $194 on Friday after declining more than 13% this week. The recent downturn has led to $38 million in total liquidations, with over $33 million coming from long positions.

SEC approves Hashdex and Franklin Templeton's combined Bitcoin and Ethereum crypto index ETFs
The SEC approved Hashdex's proposal for a crypto index ETF. The ETF currently features Bitcoin and Ethereum, with possible additions in the future. The agency also approved Franklin Templeton's amendment to its Cboe BZX for a crypto index ETF.

Bitcoin: 2025 outlook brightens on expectations of US pro-crypto policy
Bitcoin (BTC) price has surged more than 140% in 2024, reaching the $100K milestone in early December. The rally was driven by the launch of Bitcoin Spot Exchange Traded Funds (ETFs) in January and the reduced supply following the fourth halving event in April.

Best Forex Brokers with Low Spreads
VERIFIED Low spreads are crucial for reducing trading costs. Explore top Forex brokers offering competitive spreads and high leverage. Compare options for EUR/USD, GBP/USD, USD/JPY, and Gold.