Patterns: BTC/USD, ETH/USD

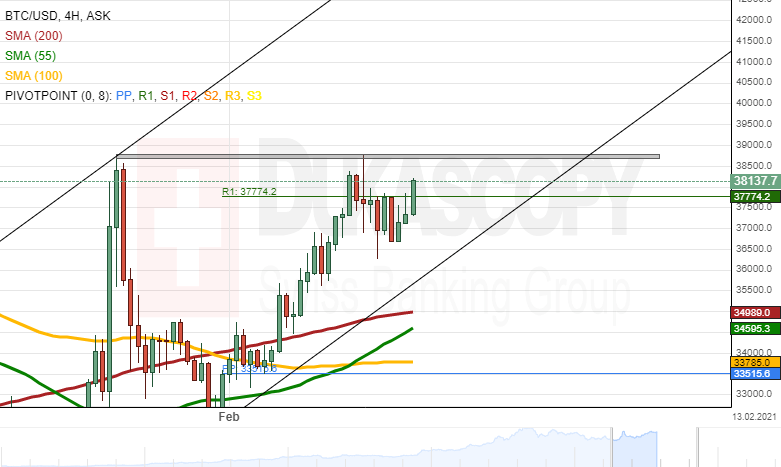
BTC/USD 4H Chart: Making attempts to surge
The price for Bitcoin recently tested the January high level just below the 39,900.00 mark and failed. However, another attempt at that level is expected. Namely, the BTC/USD rate is expected to gain support from the lower trend line of the channel up pattern that has guided the rate since the second half of January and the 55, 100 and 200- 4 hour simple moving averages.
In the case of the rate passing the high level, the all time high of 42,000.00 would be tested. However, prior to that, most likely the 40,000.00 would provide psychological resistance.
On the other hand, if the SMAs and the lower trend line of the pattern fail to provide support, the rate could look for support in the round price levels, which had previously kept it up or down. Namely, the 36,000.00 and 34,000.00 levels have provided both support and resistance.
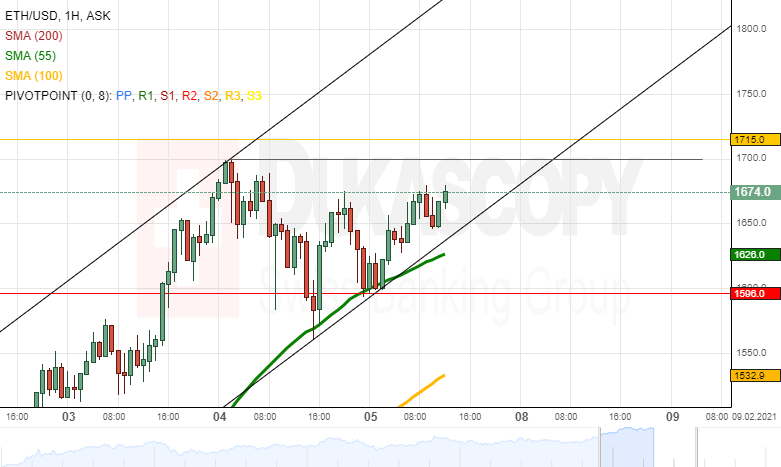
ETH/USD 1H Chart: SMA Pushes Rate up
After booking a new all-time high the price for Ethereum has consolidated and revealed a channel up pattern. Moreover, the 55-hour SMA had approached the ETH/USD rate and started to push it up. The near term future depended on whether or not the rate manages to pass the 1,700.00 level.
In the case of the pair passing the 1,700.00 mark, it would immediately test the resistance of the weekly R3 simple pivot point at 1,715.00. If this level is passed, expect resistance from round price levels like the 1,750.00 and 1,800.00.
On the other hand, if the support of the channel up pattern and the 55-hour simple moving average fails, the rate could look for support in the 1,600.00 level and the weekly R2 simple pivot point.
Author

Dukascopy Bank Team
Dukascopy Bank SA
Dukascopy Bank stands as an innovative Swiss online banking institution, with its headquarters situated in Geneva, Switzerland.


