Pancake Swap onboards Hyper Finance, while CAKE price primed for 10% upswing
- Pancake Swap announced the addition of Hyper Finance to its Syrup pools.
- The recent burn program saw $191 million worth of CAKE taken out of supply.
- CAKE price has formed a higher high as it bounced off a demand zone that extends from $34.70 to $36.27.

Pancake Swap revealed the addition of another project to its pools, which will allow its users to earn rewards as they provide liquidity. CAKE price seems to have turned over a new leaf as it signals a shift in trend.
Hyper Finance joins the Syrup pools
Pancake Swap has seen considerable growth over the past month as its pools have integrated a plethora of upcoming projects. The recent addition includes Hyper Finance, a decentralized aggregate mining platform built on the Binance Smart Chain (BSC).
As a part of this integration, the Syrup pool has allocated 5 million HYFI (Hyper Finance tokens) to be farmed by users over 60 days, starting Wednesday.
The blog reads,
In order to host the HYFI Syrup Pool, we will need to provide a HYFI-BNB farm that will have 2x CAKE rewards for the first 48 hours and then 1x CAKE rewards after that.
Another fundamental development is the burn program, which revealed that 5,324,438 CAKE worth roughly $191 million were taken out of supply.
BIGGEST BURN EVER!
— PancakeSwap #BSC (@PancakeSwap) May 10, 2021
5,324,438 $CAKE, equivalent to $191,540,470!
Just bought back $5.2M of #CAKE from the market (trading + prediction)
$116,000+ of CAKE from auto-compounding fees
$245,000+ of CAKE from NFT+Profiles
Let's make it an even bigger burn next week! pic.twitter.com/QmGx8K9ndu
This move makes the CAKE supply scarce, which might help propel its price higher, at least in the short term.
CAKE price eyes swing highs
CAKE price is trading above the 4-hour demand zone that extends from $34.70 to $36.27 after crashing nearly 13%. While the Pancake Swap token has been forming lower highs and lower lows since April 30, the recent dip set up a higher low, suggesting a shift in trend. This move indicates that the bullish momentum is starting to pour in.
Therefore, investors can expect the CAKE price to climb 10% to the local top at $40.55. A decisive 4-hour candlestick close above this barrier will signal a continuation of this uptrend to a supply zone that ranges from $41.45 to $43.10.
However, the 50 four-hour Simple Moving Average (SMA) has slid below the 100 four-hour SMA. This bearish crossover could negatively impact this bullish scenario. Investors need to keep a close eye on how these SMAs develop as CAKE price ascends.
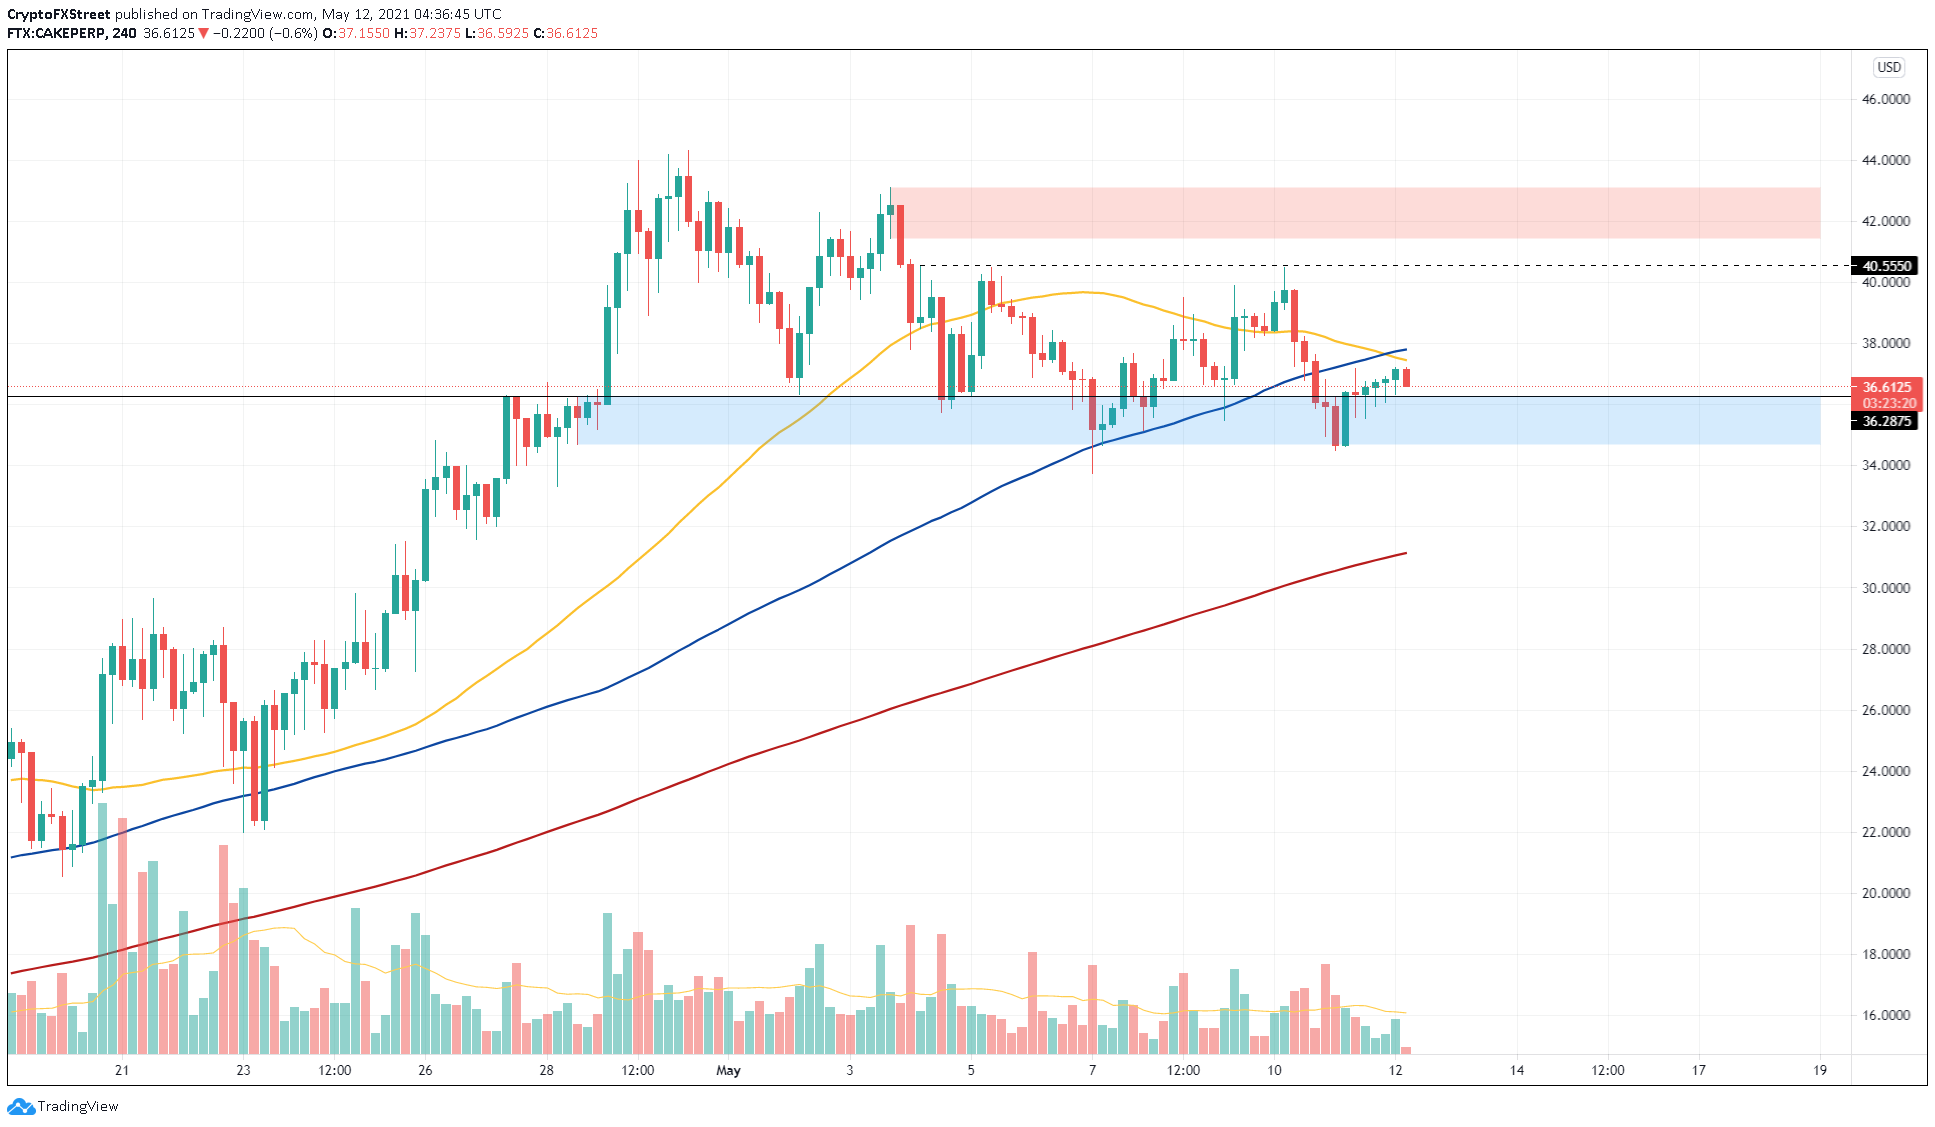
CAKE/USDT 4-hour chart
While things seem to be looking up for CAKE price, an increase in the distance between the 50 and the 100 SMA would suggest that the short-term bearish momentum is rising faster than the bullish momentum.
In such a case, market participants might expect Pancake Swap price to re-enter the aforementioned demand zone. Further continuation of this downswing leading to a breakdown of $33.75 will invalidate the bullish scenario and might trigger a sideways movement or a 7.5% crash to the 200 SMA at $31.22.
Author

Akash Girimath
FXStreet
Akash Girimath is a Mechanical Engineer interested in the chaos of the financial markets. Trying to make sense of this convoluted yet fascinating space, he switched his engineering job to become a crypto reporter and analyst.


